The SAR in this indicator stands for stop and reverse. That means that with this indicator you are always in the market. You simply reverse the position when the stop level is reached. When you are on a buy mode and the stop is reached, then you switch to a sell (or short) mode. If you are on a sell mode and the indicator turns bullish, then you switch to a buy mode.
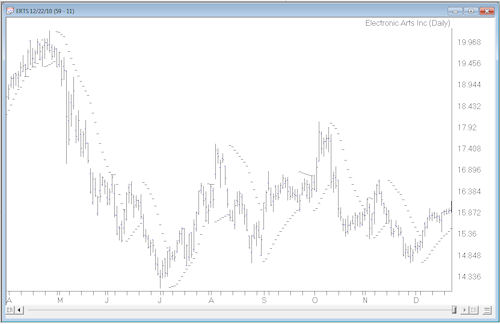
To see the Parabolic SAR indicator in the TradingExpert system, open a stock chart and click the ParaSAR indicator in the Control Panel. Since this indicator overlays the stock price chart, it is found in the upper half of the Control Panel. The Parabolic SAR indicator is shown in the chart below. The indicator gets its name from the shape assumed by the trailing stops that tend to curve like a parabola. Dots below prices indicate a long position while dots above the prices indicate a short position. The dots represent the stop and reverse points.
As the prices move higher, the rising dots below the price action tend to start out slow and then accelerate with the trend. The slow start in the indicator allows a trend to take place. As the stock moves higher, there is an acceleration factor and the indicator moves faster until it catches up to price action. The same is true for stocks that are falling. This is a trend following indicator so it obviously works best on volatile stocks that are in trends. Even on trending stocks, there will be whipsaws.
For short-term swing traders who deal with volatile stocks such as those found on the Nasdaq, the Parabolic SAR indicator may help improve entry and exit points.