Category Archives: educational newsletters

The Trend, the Trend, the Trend

In real estate, it’s “Location, Location, Location.” In the financial markets it’s “the Trend, the Trend, the Trend.”  There is a great deal of certainty about what will happen next in stocks, bonds and gold.  But the key to successfully navigating these turbulent times starts not with predicting the future but rather with identifying the current trend in the here and now and going from there.  So let’s take a look at, well, what else, the trends.

I have certain trend-following models that I follow to help me to determine which way to be leaning in the markets.  Like any trend-following method they are far from perfect (my stock market model for example, suffered not one but two significant whipsaws in the last year+).  But for me there is no expectation that they will be perfect.  The only goal is to catch most of the upside during major bull markets, and miss much of the downside during major bear markets.
Stocks
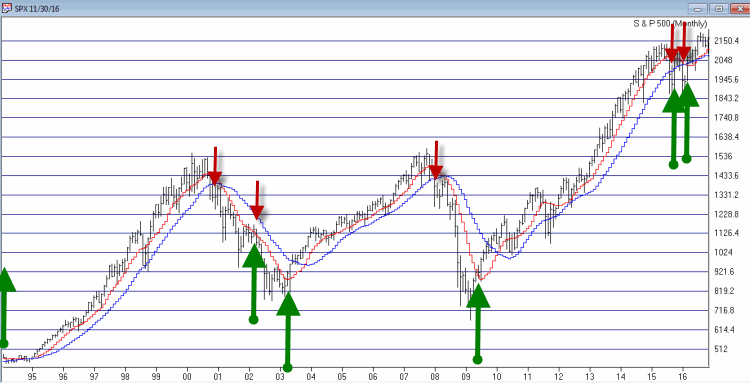
For stocks I look at the 10-month and 21-month moving averages for the S&P 500 Index and use the following rules:
*A sell signal occurs when the S&P 500 closes 2 consecutive months below its 21-month moving average AND is also below its 10-month moving average
*Following a sell signal a new buy signal occurs when the S&P 500 registers a monthly close above its 10-month moving average
stock-trend
Figure 1 – Stock Market trend-following signals (Courtesy AIQ TradingExpert)
This method avoided much of the 1973-1974, 2000-2002 and 2008 bear market destruction.  That’s the good news.  The bad news is that it sold at the end of September 2015 and at the end of February 2016 – both just prior to powerful upside reversals (like I said, trend-following models ain’t perfect).
The most recent signal was a buy signal on 3/31/2016.  
So the trend for stocks is presently BULLISH
Bonds
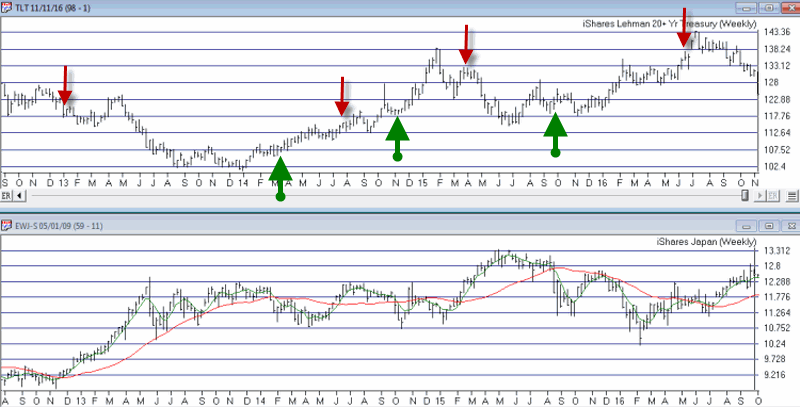
I have written several posts about this in the past.  My favorite bond timing indicator is Japanese stocks.  No seriously.  They have a string tendency to trade inversely to the 30-yr US t-bond.  I track ticker EWJ and watch the 5-week and 30-week moving averages.  Because Japanese stocks and t-bonds trade inversely I use the following rules:
*A buy signal for bonds occurs when the 5-week moving average for EWJ drops below the 30-week moving average for EWJ
*A sell signal for bonds occurs when the 5-week moving average for EWJ rises above the 30-week moving average for EWJ
The most recent signal was a sell signal for t-bonds on 6/10/2016
So the trend for bonds is presently BEARISH
bond-trend
Figure 2 – Bond trend-following signals(Courtesy AIQ TradingExpert)
Gold
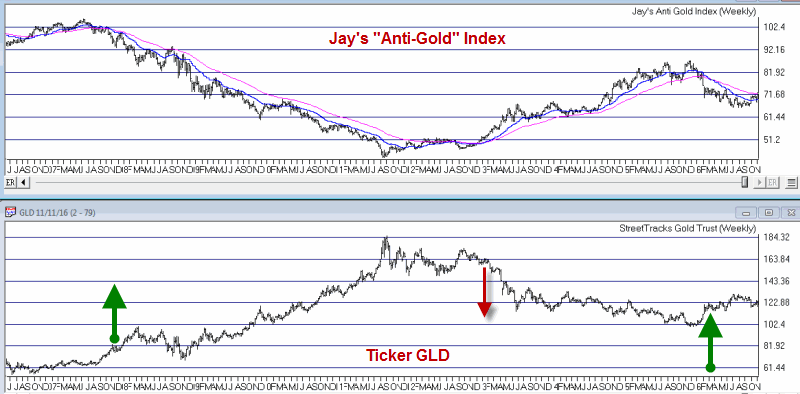
For gold I use two moving averages on a weekly chart for something I refer to as Jay’s Anti-Gold Index.  Rather than go into a long explanation I will link to the original article on the topic and offer a short explanation.  In AIQ TradingExpert I created a ticker comprised of 4 other tickers (GLL, RYSDX, SPX and YCS) which all trade in a negatively correlated manner to the price of gold (er, usually).
One moving average I call the “FrontWeighted36DayMA” (“FrontWeightedMA” for short.  The calculations are based on someone else’s work – unfortunately I cannot recall the person’s name so cannot give proper credit.  Hopefully Karma will work and somewhere that person will  Have a Nice Day without really knowing why.  The calculations are a bit long-winded so the AIQ TradingExpert code appears at the end of this article.
The other is the 55-week exponential moving average.
(CAVEAT: Because some of these tickers did not exist until 2006 trading signals began on 12/31/1996, so yes, it is by my standards a relatively short test period for a long -term moving average method.  To put it another way, don’t bet the ranch on  gold basedon this one indicator)
The trading rules are as follows:
*When the FrontWeightedMA closes a week BELOW the 55-week MA then a BUY signal for gold occurs.
*When the FrontWeightedMA closes a week ABOVE the 55-week MA then a BUY signal for gold occurs.
gold-signals-3
Figure 3 – Gold Trading Signals (Courtesy AIQ TradingExpert)
The most recent signal was a buy signal on 3/18/16.
So the trend for gold is presently BULLISH.
Summary
These indicators represent “my opinion as to where the markets are headed next” (because the truth is I don’t know).  There are objective, mechanical measures of where things stand today.  Nothing more, nothing less.
Also, none these indicators falls into the “World Beater” or “You Can’t Lose in Investing” categories.  But then again they are not really designed to (BTW if you do posses methods that do fit into either of the aforementioned categories, I would love to hear from you – off the record, of course).  What they do achieve is to offer a decent frame of reference during times of doubt.
And that is one of the most powerful tools any investor can possess.
So in sum, the current trend (at least according to what you’ve seen here) for stocks and gold is bullish and the current trend for bonds is bearish.
How long any of these trends will remain in place is anyone’s guess.  So enjoy them while they last.

Jay Kaeppel
Chief Market Analyst at JayOnTheMarkets.com and AIQ TradingExpert Pro (http://www.aiqsystems.com) client

The Best Bear Market Strategy

OK, I suppose I should refer to this as “my” best bear market strategy.  For the record, “the” best bear market strategy is to sell short at the top and buy back at the bottom.  Which reminds me, if you possess information on how to achieve this objective please feel free to pass your contact info on to me.  Barring that, what follows is a pretty decent approach to dealing with bear markets.

Also, I will grant you that this is not the most “timely” article in the world, since we are not technically now in a bear market.  Still it never hurts to “be prepared”, so I want to highlight one approach to trading a bear market.

First the bad news: this method involves a fair amount of trading – at least two trades a month to be specific.  While this may not be everyone’s cup of tea, ultimately – using here the ubiquitous, annoying and yet highly appropriate phrase for our times – “It is what it is.”

Jay’s Bear Market Method

There are three parts:

  1. The Dow versus its 200-day moving average
  2. Specific trading days of the month
  3. Market Holidays

Dow versus 200-day moving average

For our purposes we will designate the stock market as being in a bear market when the Dow Jones Industrials Average is below its 200-day moving average.  To sum it up as succinctly as possible:

Dow > 200-day moving average = GOOD

Dow < 200-day moving average = BAD

One important note: For trading purposes I use a one-day lag when a crossover occurs.  If the Dow closes above the 200-day MA on Monday and then closes below it on Tuesday, then in theory the market turns bearish at the close on Tuesday.  However, for actual trading purposes it is pretty tough to get a trade off at the close on Tuesday when you don’t know for sure that you should until…the close on Tuesday.

So for the record, for our purposes a “bearish” period begins at the close on the day afterthe Dow first closes below its 200-day moving average.  Likewise, the bearish period ends at the close one trading day after the Dow closes back above its 200-day moving average.

Trading Days of Month

When our 200-day moving average indicator above is “bearish” we designate the following trading days of the month as “bullish”

*The last 4 trading days of the month and the first 3 trading days of the next month

*Trading days #9, 10, 11 and 12

In other words, when the Dow is below its 200-day moving average we want to be long the stock market on these days

Holidays

In addition to the trading days listed above, when our 200-day moving average indicator above is “bearish” we also want to be long the stock market on the 3 trading days before and the 3 trading days after each stock market holiday (New Years, Martin Luther King Day, President’s Day, etc.)

Results

So what does all of this do for us?  The results appear in Figure 1 below.  To review, these results measure the growth of $1,000 invested in the Dow Jones Industrials Average only when:

*The Dow is below its 200-day moving average (with a 1-day lag following the crossover before a bearish period begins or ends)

*Today is within 3 trading days before or after a market holiday OR today is one of the last 4 trading days of the months, one of the first 3 trading days of the month or falls within trading days #9 through 12.

The blue line depicts the growth using Jay’s Bear Market Method.  The red line depicts the growth from buying and holding the Dow Industrials Average while our 200-day moving average indicator is  “bearish.”

1

Figure 1 – Growth of $1,000 invested in Dow using Jay’s Bear Market Method (blue line) versus $1,000 invested in Dow on all days when the Dow is below its 200-day moving average* (red line); 12/31/1938-9/26/2016

* – using a 1-day lag for crossovers

For the record, since 12/31/1938:

*$1,000 invested in the Dow only when the trend is “bearish” (i.e., below the 200-day moving average with a 1-day lag on crossovers) grew to $1,675 (or+67%)

*$1,000 invested in the Dow only when Jay’s Bear Market Method is bullish grew to $22,542 (or +2,154%).  Now that’s what I call “making the best of a bad situation”.

The Worst of the Worst

Figure 2 displays the performance of the Dow during the “Worst of the Worst” trading days.  In this scenario:

*The Dow is below its 200-day moving average (again with a 1-day lag for crossovers)

*Today is NOT one of the trading days of the month listed above and is NOT within 3 trading days of a market holiday.

2

Figure 2 – Growth of $1,000 invested in Dow when Dow is below 200-day moving average AND today is NOT one of the favorable trading days listed above; 12/31/1938-9/26/2016

For the record, $1,000 invested in the Dow ONLY on these “Worst of the Worst” trading days by -88% to $114 since 1938. Now that’s what I call a bear market.

Jay Kaeppel

Chief Market Analyst at JayOnTheMarkets.com and AIQ TradingExpert Pro (http://www.aiqsystems.com) client

Seasonal Bonds Strategy using TMF

Recently Jay Kaeppel of Jay On The Markets posted an update on the Seasonal Bonds Strategy using TMF. The gist of the strategy is straightforward,  “Long TMF on the last 5 day of each month” 

I’ve posted the article below. 

Here’s a seasonal chart of the last 3 years with the average of the 3 years (black line). I colored the last 5 trading days of the average line in yellow to see what Jay was referring to. 8 of the 12 months were positive, 2 flat and 2 negative. Looks pretty good. At the bottom of the page you can see the returns this strategy yields.

BTW this Chart type, known as a seasonality chart will be included in the next AIQ TradingExpert Pro release this fall (OK marketing bit over) 


On 3/15/15 I wrote about an even more aggressive strategy using triple-leveraged ticker TMF that tracks long-term t-bonds using leverage of 3-to-1.
So of course the bond market rewarded my “brilliance” with a swift kick in the you know where in the months of March and April 2015 and especially in August 2015.
This would typically be enough to cause many people to go, “Well that guy’s and idiot” and to move on.  But fortunately in this case, the market is a marathon and not a sprint.
Update
Figure 1 displays the results generated by:
*Holding long 1 t-bond futures contract ONLY for the last 5 days of each month since 12/30/1983
*Holding long 1 t-bond futures contract during all other days since 12/30/19831
Figure 1 – Long 1 t-bond futures contract ONLY during last 5 trading days of month (blue) versus long 1 t-bond futures contract on all other days  (red); 12/31/1983-8/12/2016
The results sort of speak for themselves.
After I wrote about my aggressive TMF strategy, TMF (of course) got hit very hard (as triple leveraged ETFs will do from time to time, hence the use of the words “aggressive” and “risky”), in March 2015 (-4.5%), April 2015 (-5.3%) and especially in August 2015 (-11.5%).
Still, as you can see in Figure 2, things have rebounded nicely since (hmmm, maybe I should be worried).2
Figure 2– Growth of $1,000 Long ETF ticker TMF ONLY during last 5 trading days of month (blue) versus long TMF all other days; (red); 12/9/2009-8/12/2016
So far the “Long TMF on the last 5 day of each month” strategy is up +31.8% for the year in 2016.
Year Last 5 TDM Long TMF
2009* +12.9%
2010 +33.4%
2011 +15.2%
2012 +35.7%
2013 +6.7%
2014 +45.7%
2015 +6.8%
2016** +31.8%
*-Starting 4/16/2009 when TMF started trading
**-Through 8/12/2016
Summary
So did this odd little strategy “weather the storm” and “take the market’s best shot” in 2015 and now it is “smooth sailing”?  Probably not.  Make no mistake – this is a strategy that entails a great deal of risk.  Still, for aggressive traders looking for an “edge”, it might be worth a closer look.
Jay Kaeppel

The 3 Days of the Month to Avoid

Some days are just better than others – am I right or am I right?  As a corollary, some days are worse than others.  Wouldn’t it be nice to know in advance which days were going to be which?

Well, when it comes to the stock market, maybe you can.

The 3 Days to Miss

For our purposes we will refer to the very last trading day of the month as TDM -1.  The day before that will be TDM -2, the one before that TDM -3, etc.  Now let’s focus specifically on TDMs -7, -6 and -5.

Let’s now assume that we will buy and hold the Dow Jones Industrials Average every day of every month EXCEPT for those three days – i.e., we will sell at the close of TDM -8 every single month and buy back in 3 days later.  We will refer to this as Jay’s -765 Method.  Granted some may not be comfortable trading this often, but before dismissing the idea please consider the results.

Figure 1 displays the growth of $1,000 invested in the Dow as described above versus the growth of $1,000 from buying and holding the Dow.

*The starting date for this test is 12/1/1933.
*For this test no interest is assumed on the 3 days a month spent out of the market.
1

Figure 1 – Growth of $1,000 invested in Dow Industrials during all days EXCEPT TDM -7,TDM -6 and TDM -5 (blue line) versus $1,000 invested in Dow Industrials using buy-and-hold (red line); 12/1/1933-8/15/2016

For the record:
*Jay’s -765 Method gained +94,190%
*The Dow buy-and-hold gained +18,745%

While these results are compelling, the real “Wow” comes from looking at would have happened if you had been long the Dow ONLY on TDMs -7,-6 and -5 every month since 1933.  These results appear in Figure 2 (but you’d better brace yourself before taking a glance).
2

Figure 2 – Growth of $1,000 invested in the Dow ONLY on the 7th to last, 6th to last and 5th to last trading days of every month since 12/1/1933

The net result is an almost unrelenting 83 year decline of -80%.

Summary

I would guess that some readers would like me to offer a detailed and logical reason as to why this works.  Unfortunately, I will have to go with my stock answer of “It beats me.”  Of course, as a proud graduate of “The School of Whatever Works” (Team Cheer: “Whatever!”) I am not as interested in the “Why” of things as I am the “How Much.”

Sorry, it’s just my nature.

Jay Kaeppel
Chief Market Analyst at JayOnTheMarkets.com and AIQ TradingExpert Pro (http://www.aiqsystems.com) client

Hedging Risk Away with Ticker TZA

It pains me to say that I don’t know where the stock market is going next.  You would think that after being in the markets for so long and following a bunch of indicators and systems etc., that by now I would have developed some ability to divine what is coming next.
Alas, I have not.
But I do know three things:
*My trend-following stuff is bullish so I need to give the bullish case the benefit of the doubt (no matter how nervous or cynical I may be).
*Based on a variety of indicators the market is certainly getting overbought
*Based on the calendar, some caution may be in order
So, a thought today for those who might be wishing to hedge away some of their market risk.
Ticker TZA
Ticker TZA is not necessarily one of my favorites.  It is an ETF that tracks 3 times the inverse of the Russell 2000 small-cap index. In other words, if ticker RUT falls 1% today then TZA should rise 3%.  There are two primary concerns to keep in mind before considering buying shares of TZA are:
*The shares are extremely volatile
*The shares have experienced a serious downside bias – even when RUT is headed sideways (See Figure 1).
1
Figure 1 – Ticker TZA (black bars) versus Ticker RUT (Russell 2000) (Courtesy AIQ TradingExpert)
So if you are going to buy TZA you’d better pick your spots. As I discussed here we are entering an “interesting” time for the market.  So let’s explore the possibility of buying a call option on ticker TZA as a hedge against a potential market decline.
Call Option on TZA
Remember, TZA should increase in value if the Russell 2000 declines.  Therefore, a call option on TZA should also increase in value if the Russell 2000 declines.
As you can see in Figure 2, the “implied volatility” (which generally tells you whether there is a lot of time premium built into the price of the options for a given security) for options on TZA is near the low end of the historical range.  This tells us that there is relatively little time premium built into TZA options, therefore they are “cheap”.
2
Figure 2 – Implied option volatility for options on TA near the low end of the historical range (Courtesy www.OptionsAnalysis.com)
Next I ran the “Percent to Double” routine in www.OptionsAnalysis.com (see output in Figure 3.  The phrase “percent to double” tells us what percentage the underlying stock must rise in order for the call option to double in price.
3
Figure 3 – Percent to Double routine suggests buying Sep30 TZA call which will double in price if TZA rises 12.56% (i.e., if RUT declines by roughly -4.19%) (Courtesy www.OptionsAnalysis.com)
Figures 4 and 5 display the particulars and risk curves for buying 10 TZA Sep 30 calls.
4
Figure 4 – TZA Sep30 details (Courtesy www.OptionsAnalysis.com
5
Figure 5 – TZA Sep30 risk curves (Courtesy www.OptionsAnalysis.com)
A few things to note:
*The cost to buy 10 is $2,550.
*TZA is trading at $30.25/share.
*The breakeven price for this trade is $32.25 (if TZA is below $32.25 at expiration and we still hold this position then we will lose -$2,250)
*There are 50 days left until September expiration
*The trade has unlimited profit potential
Regarding potential, in Figure 6 we see that if TZA rallies back to its June low of $33.77 this trade will generate a profit of between $1,500 and $2,400 depending on how soon  that price is reached
6
Figure 6 – A potential 1st profit target for TZA hedge (Courtesy www.OptionsAnalysis.com)
Summary
Is this a good trade?  I can’t say for sure that it is.  In fact, the only way this trade makes money is if the broader market suffers a hit, so a good part of me would prefer to see this trade “not work out”.
But the point of all of this is simply to point out that it is possible to hedge against a significant market decline by buying call options on an inverse leveraged ETF.
Mr. Market, you take it from here.
Jay Kaeppel
Chief Market Analyst at JayOnTheMarkets.com and AIQ TradingExpert Pro (http://www.aiqsystems.com) client