The AIQ TradingExpert Pro Market Timing signals are not a perfect system. If they were no doubt the founders of AIQ would have kept it secret and traded the signals themselves.
The signals that give us early waring of a change in direction of the market are proprietary. The 400 rules that are used by the Artificial Intelligence inference engine to determine change of market direction use many of the widely known technical tools.
The rating calculation and the indicators contributing to the ratings have not been changed for many years. A decision was made some years ago to avoid constantly moving the goalposts as the constant optimizing or back fitting erodes the validity of the system.
High ratings to the upside or downside of notice have to be 95 or greater (the maximum is 100). the ratings are considered confirmed when the Phase indicator that is outside of the AI system, changes in the direction of the high rating.
So ratings have fired in the last few months how do we confirm them?
We look for the Phase indicator ( a derivative of MACD) to change in the direction of the signal. This needs to occur within a 3 day window before or after the rating.
The last 2 market timing signals illustrate this nicely.
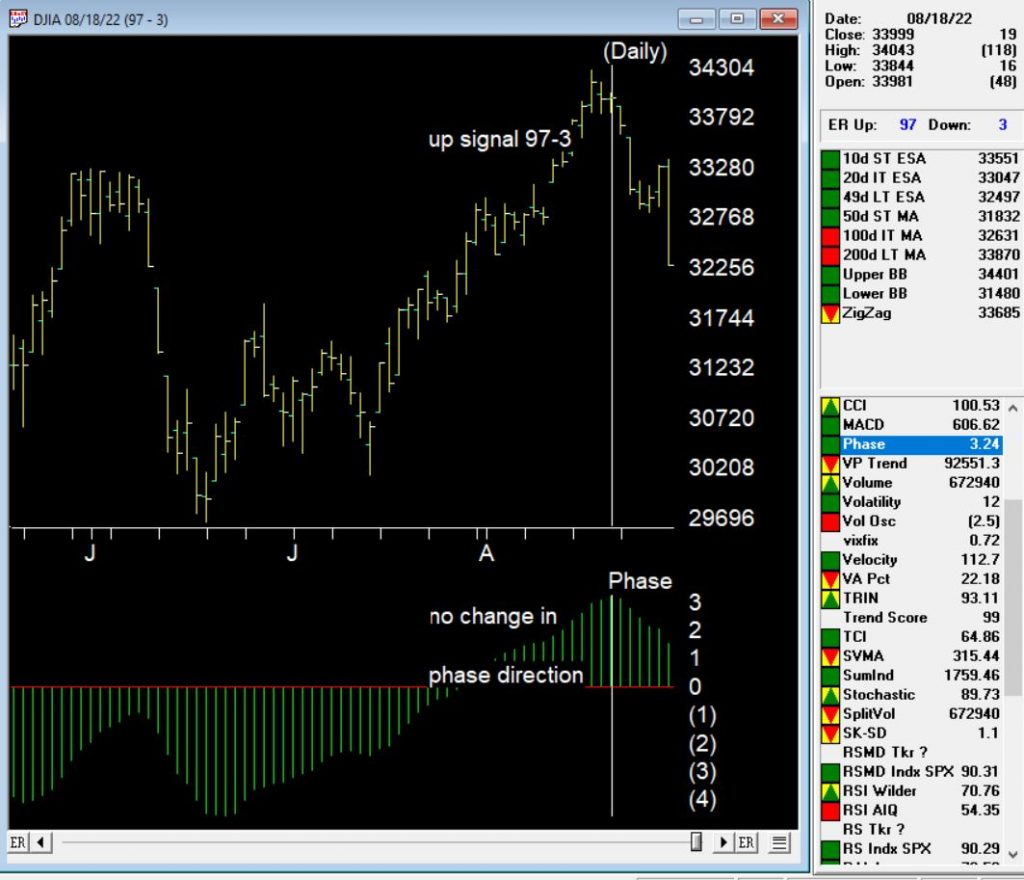
August 18, 2022 97-2 up signal on the market
The up signal occurred during a a 3 day down period on the uptrend, however the Phase indicator did not change direction (it would need to turn up after going down) within the window for confirmation. This signal is therefore unconfirmed by Phase.
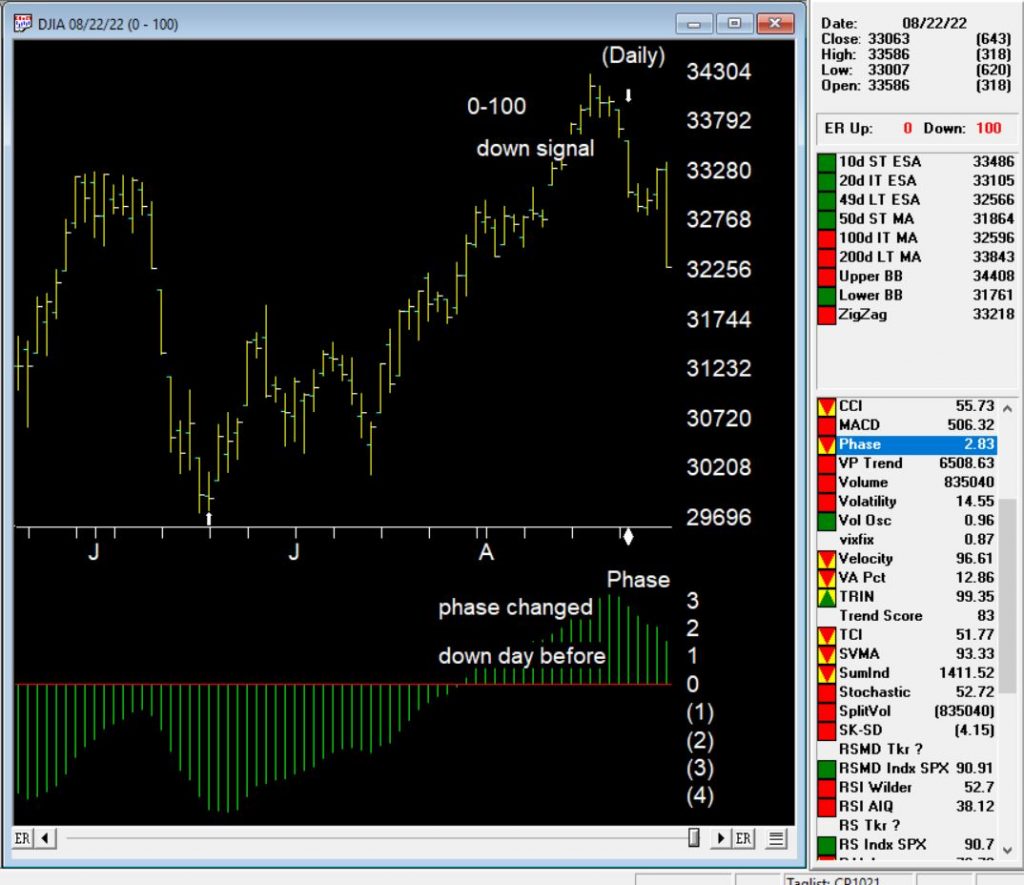
August 22, 2022 down signal on the market
The down signal occurred on 8-22-22. 100 down is the strongest signal the market timing generates. In this case the Phase turned down after a prolonged upward move, on the day before the signal. This is considered a confirmed down signal on the market.
The rules that contributed to 0-100 down on the market
The 100 down signal is the strongest signal the AI system generates. Here are the major technical events that contribute to this rating.
Trend Status has changed to a strong down trend. This indicates that a downward trend has started that may continue in this direction. This is a moderate bearish signal.
The 21 day stochastic has declined below the 80% line and the price phase indicator is decreasing. In this strongly downtrending market this is an indication that the downtrend will continue.
Volume accumulation percentage is decreasing and the 21 day stochastic has moved below the 80% line. In this strongly down market, this is taken as a very strong bearish signal that could be followed by a downward price movement.
The exponentially smoothed advance/decline line has turned negative when the up/down volume oscillator and the advance/decline oscillator are already negative. In this market, this is viewed as a bearish signal that could precede a downward price movement.
The up/down volume oscillator has turned negative when the exponentially smoothed advance/decline line and the advance/decline oscillator are already negative. In this market, this is viewed as a bearish signal that could precede a downward price movement.
The new high/new low indicator has reversed to the downside. This is a reliable bearish signal that is often followed by an downward price movement. In this market a continued strong downtrend can be expected.
The importable AIQ EDS file based on Markos Katsanos’ article in the August 2022 issue of Stocks & Commodities magazine, “Trading The Fear Index” and the “CUM1.csv” file can be obtained on request via email to info@TradersEdgeSystems.com. Code for the author’s system is set up in the AIQ code file.
Synopsis: Here is a long-short strategy to capitalize on stock market volatility using volatility-based exchange-traded funds (ETFs or ETNs)…
! VIX ETF SYSTEM
 ! This should be applied only to long VIX ETF.
 ! VIX ETF DAILY LONG-SHORT TRADING SYSTEM
 ! COPYRIGHT MARKOS KATSANOS 2022
 ! To be applied on a daily chart of long VIX ETFs:
   ! VXX,VIXY,UVXY,VIXM,VXZ,SVOL
 ! INPUTS:
 C is [close].
 H is [high].
 L is [low].
 VIXUPMAX is 50. ! VIX UP% MAX
 VBARS is 6.         ! Number of bars to calculate VIXUP,VIXDN & RC
 STBARSL is 25.   ! Number of bars to calculate slow stochastic
 STBARSS is 10.   ! Number of bars to calculate fast stochastic
 ! COMPARISON INDEX
 VIXC is TickerUDF("VIX",C).
 VIXH is TickerUDF("VIX",H).
 VIXL is TickerUDF("VIX",L).
 SPYC is TickerUDF("SPY",C).
 SPYH is TickerUDF("SPY",H).
 SPYL is TickerUDF("SPY",L).
 ! STOCHASTIC
 STOCHVS is (VIXC-lowresult(VIXL,STBARSS))/(highresult(VIXH, STBARSS)-lowresult(VIXL, STBARSS)+0.0001)100. STVIXS is simpleavg(STOCHVS,3). STOCHSS is (SPYC-lowresult(SPYL,STBARSS))/(highresult(SPYH,STBARSS)-lowresult(SPYL,STBARSS)+0.0001)100.
 STSPYS is simpleavg(STOCHSS,3).
 STOCHVL is (VIXC-lowresult(VIXL,STBARSL))/(highresult(VIXH,STBARSL)-lowresult(VIXL,STBARSL)+0.0001)100. STVIXL is simpleavg(STOCHVL,3). STOCHSL is (SPYC-lowresult(SPYL,STBARSL))/(highresult(SPYH,STBARSL)-lowresult(SPYL,STBARSL)+0.0001)100.
 STSPYL is simpleavg(STOCHSL,3).
 !VIX
 VIXDN is (VIXC/valresult(highresult(VIXC,VBARS),1)-1)100.  VIXUP is (VIXH/valresult(lowresult(VIXL,VBARS),1)-1)100.
 ! CORRELATION TREND
 PeriodToTest is VBARS-1.
   !CUM1 is a custom ticker from DTU import of a CSV file**   !CUM1 file is required for this system to work
      ! PEARSON CORRELATION
 ValIndex is TickerUDF("VIX", [close]).
 ValTkr is TickerUDF("CUM1", [close]).
 SumXSquared is Sum(Power(ValIndex,2), PeriodToTest).
 SumX is Sum(ValIndex, PeriodToTest).
 SumYSquared is Sum(Power(ValTkr,2), PeriodToTest).
 SumY is Sum(ValTkr, PeriodToTest).
 SumXY is Sum(ValTkr*ValIndex, PeriodToTest).
 SP is SumXY - ( (SumX * SumY) / PeriodToTest ).
 SSx is SumXSquared - ( (SumX * SumX) / PeriodToTest ).
 SSy is SumYSquared - ( (SumY * SumY) / PeriodToTest ).
 RC is SP/SQRT(SSx*SSy).
 !LONG
 BR1 if HasDataFor(STBARSL+10)>STBARSL+3.
 BR2 if STVIXL>STSPYL .
 BR3 if STVIXS>STSPYS.
 BR4 if STVIXS>valresult(STVIXS,1).
 BR5 if VIXUP>VIXUPMAX.
 BR6 if RC>0.8.
 BR7 if RC>valresult(RC,1).
 BUY if BR1 and BR2 and BR3 and BR4 and BR5 and BR6 and BR7.
 SR1 is STSPYS>STVIXS.
 SR2 is STVIXS<valresult(STVIXS,1).
 SELL if SR1 or SR2.
 !SHORT
 SS1 if HasDataFor(STBARSS+10)>STBARSS+3.
 SS2 if VIXC<= lowresult(VIXC,3). SS3 if VIXUP15.
 SS6 if STSPYS>STVIXS.
 SS7 if STSPYS>valresult(STSPYS,1).
 SHORT if SS1 and SS2 and SS3 and SS4 and SS5 and SS6 and SS7.
 CR1 if VIXUP>VIXUPMAX.
 CR2 if STVIXS>valresult(STVIXS,1).
 CR3 if RC>0.8.
 COVER if CR1 and CR2 and CR3.
 TEST if 1=1.
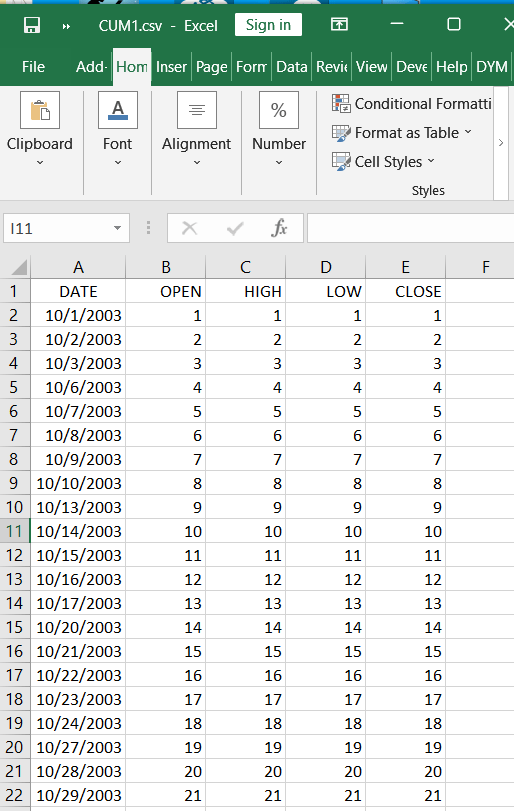
Figure 6 shows the CUM1.csv file that must be created in Excel and then imported using the DTU utility to a new index ticker called “CUM1.” The file increments one unit, like an index, for each trading day starting on 10/1/2003 and continues to the current date. This file would have to be updated manually via the data manager function.
FIGURE 6: AIQ SYSTEMS. This shows the portion of the CUM1.csv file that must be created in Excel.
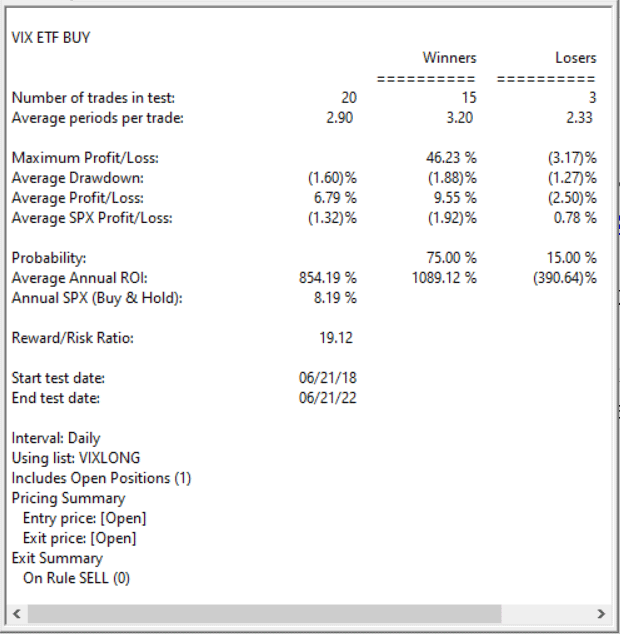
Figure 7 shows a summary EDS backtest of the system using the VXX and VXZ from 6/21/2018 to 6/21/2022.
FIGURE 7: AIQ SYSTEMS. This shows a summary EDS backtest of the system using the VXX and VXZ from 6/21/2018 to 6/21/2022.
High ER Up and ER Down signals as a color study on DJI
Hour-long recording of session with Steve Hill, CEO of AIQ Systems. We explored some indicator trading strategies and undertook some testing of effectiveness. Wenalso combined them together into one strategy, prior to adding them as a Color Study.
July 20, 2022 05:00 PM Eastern Time (US and Canada)
Topic: Indicator Trading Strategies and Custom Studies Hour-long session with Steve Hill, CEO of AIQ Systems. We’ll explore some indicator trading strategies and we’ll undertake some testing of effectiveness. We’ll also combine them together into one strategy, prior to adding them as a Color Study.
I hope all you are having a nice summer, and you are healthy and happy. At this time, there are so many global disruptions that are affecting markets simultaneously. If you look at history, daily markets are affected by short-term disruptions. Which is why being a Financial Advisor for as long as I have and watching the many disruptions that cause short-term spikes and dips, you tend to try to keep clients calm and remind them that “this too shall pass” and to stay the course on their long-term objectives.
My goal is to reassure everyone that the market over the LONG-TERM has done very well, but some years including this current year markets can go down. According to CNBC, 2022 has had the worst stock market year since 1970 and the worst Government Bond market since the 1860s. Since 1970 the market according to stockcharts.com has averaged over 10.46% per year, but in some years the markets drop, sometimes stocks and bonds drop, but it is normal. I can only advise you with the almost 42 years of being a financial advisor, out of fear people tend to panic and sell at bottoms and buy at the top.
How do financially independent people make money in the markets? They buy investments when no one else wants them, they are sticking to their long-term goals. When things are relatively cheap, they start accumulating good long-term investments, only.
So many stocks are down 40-80%, but if the companies are good and strong then they might a good investment when things turn around and they should be in my opinion over the next year. The main reason I write the Bartometer, is to keep you abreast of how best to navigate through market trends.
2021 Recap:
Most of 2021, last year I was saying do not buy, the markets are too overvalued and take some money off the table.
Current Market Trends:
Right now, I am saying to nibble and dollar cost average over the next 6 months to a year as I think you will be getting much better prices. If you are putting money in your 401(k) you may want to double up your investments for a while. This decline will pass in my opinion. You make money in the Bull Markets by Buying in the Bear Markets unless you are a trader.
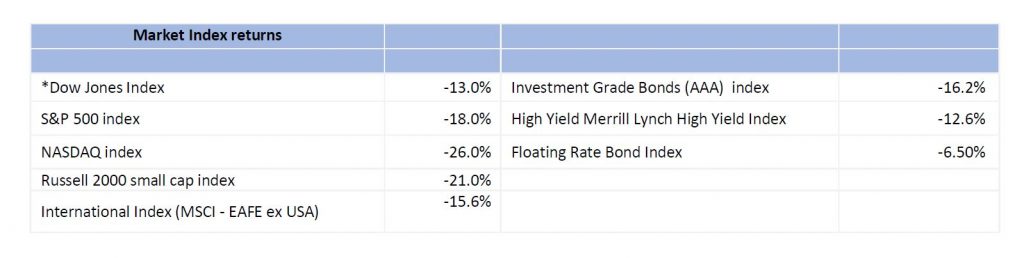
The markets are still down 18-32% or more for the year and even Energy stocks were the biggest losers over the last month dropping about 18% over the last 30 days. Most of you have seen a decline in gas prices recently. Inflationary pressures are starting to subside somewhat. This is good news.
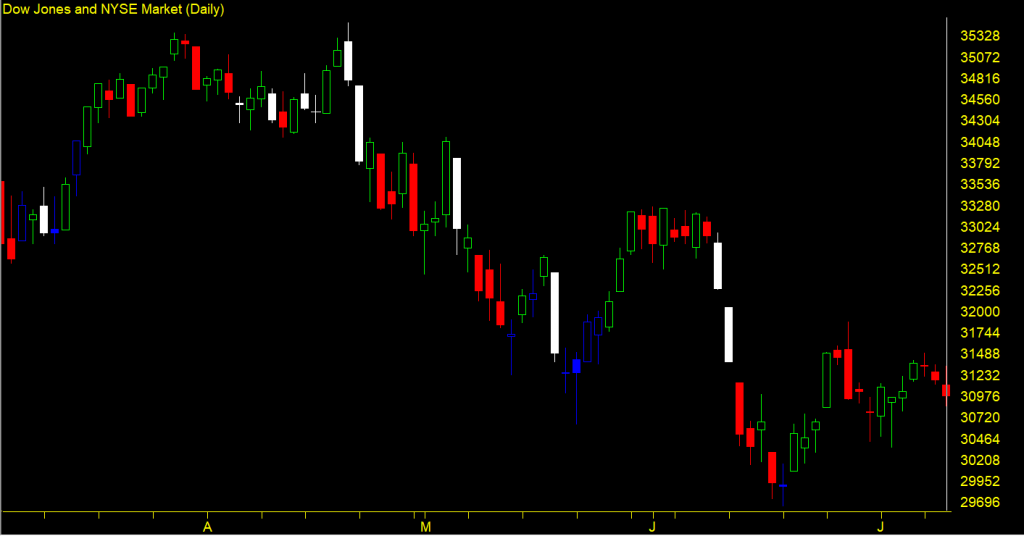
Last month on the Bartometer you all have I said the S&P 500 could drop to the 3500 to 3650 level and that could be a short term low or a good place to buy a little and the S&P 500 went to 3620 and rebounded, currently:
• S&P 500 is over 3900 again and the Federal Reserve may raise interest rates one or 2 more times based on the data that is coming out.
• Job numbers just came out and they were better than expected so rates will probably go higher but there is talk now that the economy may not go into a hard recession but a soft landing.
If that is true, then the markets may not go as low as the Doomsday Sayers” of 2500 on the S&P 500. There are points where investors are looking for a turnaround in the market. So, if we are in a soft-landing scenario, and that is a big IF, we MAY have another 10+ percent down in the market to the 3200 to 3500 area but only if earnings are going to fall or are revised down significantly. For most of you the upside could be 4200 this year and from this point it could go down to 3200 to 3500 if earnings drop. But I am hopeful that over the next year or so the markets are up, and we get inflation under control and earnings turnaround. I think any dip of the S&P 500 to the 3200 to the 3500 could be major buying opportunity. I can’t guarantee it as it depends on data. Short term I see 3200 to 3500 as a possible short term low and 4200 on the upside if earnings are not revised down and rates stop going up.
Next year I see the market going higher because I see earnings rebounding and interest rates subsiding. THINK LONG TERM.
Some of the INDEXES of the markets both equities and interest rates are below. The source is Morningstar.com up until July 08, 2022. These are passive indexes.
Market Outlook
Stocks moved higher this week with the major indexes up 2% to 5%. The S&P500 was up 2%, while the Nasdaq gained 5%. Economic news was mixed, as were business surveys, which gave conflicting signals on the strength of the economy. Positively, longer-term interest rates have remained relatively stable and inflationary expectations as measured with the 10-year T-Note continued to trend down. They were recently 2.3%, down from 2¾% a month ago. Another positive, the S&P500 and the Nasdaq moved above two key areas of resistance (the 10- and 21-day averages). A negative, the stock market gains all came on very light trading volume. In a healthy stock market, upward moves occur on strong volume.
My Epoch Times article on shortages highlights the government’s role in preventing businesses from getting goods to consumers. Another such government move comes from a California law directed against independent truckers and other independent contractors. If enforced, tens of thousands of independent truckers will not be able to operate in CA. This increases the potential for damage to CA and for more shortages throughout the country damaging the supply chain.
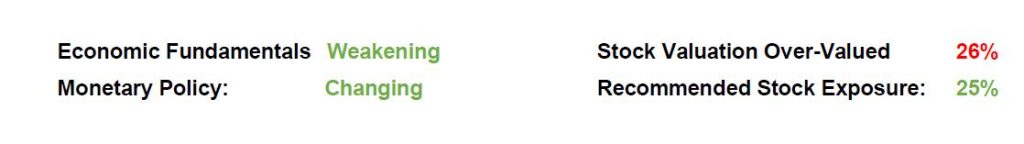
While the rally in stock prices provides some relief, stocks are 26% overvalued. With the Fed promising to sell securities and raise interest rates, the risks to owning stocks remains extremely high.
A Look Back Today’s job report shows strong gains for June. Private payroll jobs increased 381,000, a 3.6% annual rate. Total weekly hours worked and average weekly earnings increased at annual rates of 4% and 6%. Unemployment remained 3.6%.
This is a reduction of his stock allocation.
Dr Robert Genetski, American Strategic Advisors and LPL Financial are not affiliated. The opinions expressed in this material do necessarily reflect the views of LPL Financial.
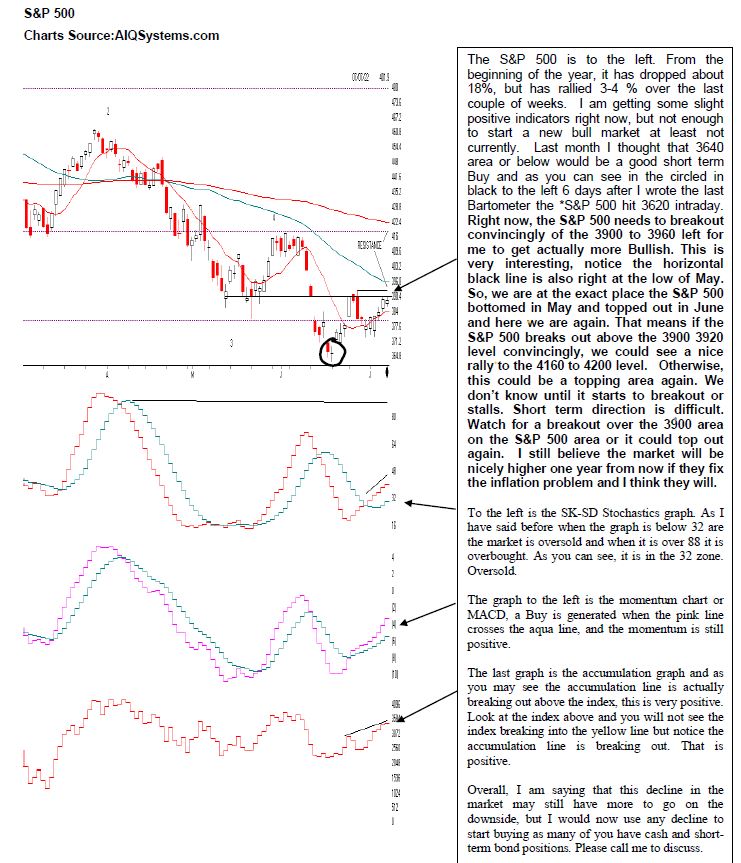
SUPPORT AND RESISTANCE LEVELS ON THE S&P 500
RESISTANCE 3920 TO 3960 (RIGHT WHERE WE CLOSED FRIDAY) then 4178,4224 and 4322
SUPPORT 3645, 3506 the 50% Fibonacci Retracement, 3195 the 61.8% Fibonacci Retracement. These are areas not exact numbers
Bottom Line
• The market has had one of the worst years in 50 years in a long time dropping 18-50% The cause?? Overvaluation, Higher Interest rates, INFLATION, Recessionary pressures, Covid and the Russian War and China.
• Interest rates are rising and could rise 1 to 3 more times. At that time if interest rates peak because inflation is peaking then stocks and regular bonds may be a worthwhile investment.
• In addition, stocks with pricing power and with good consistent earnings can do better than aggressive companies that have potential but no earnings.
• Commodities have sold off somewhat leading me to believe that the Federal Reserve may not raise interest rates substantially from here.
• The market is at an inflection point where normally it would top as it is at resistance right now and will either push through short term resistance or sell off here.
I am still long term bullish on equities, but the short term could get very volatile over the next 2 to 4 months. The upside might be 4178 to 4400 on the S&P 500, but I would consider selling some if it goes there over the next 2 months but the downside could be the 3650 level or lower possibly to the 3500 level if we go into a soft recession then the 3180 to 3200 is possible if the recession is steeper. At that point the markets could be a great buying opportunity. This is predicated on the actions of the Federal Reserve. I will continue to do my analysis and inform you when a bottom looks imminent.
The Best to all of you, Joe Bartosiewicz, CFP® LPL Investment Advisor Representative Contact information: Joe Bartosiewicz, CFP® Partner Wealth Manager American Strategic Advisors 263 Tresser Blvd 1st Floor Stamford CT 06901 860-940-7020
SECURITIES AND ADVISORY SERVICES OFFERED THROUGH LPL Financial, a registered investment advisor, MEMBER FINRA/SIPC.
Charts provided by AIQ Systems
Disclaimer: The views expressed are not necessarily the view of LPL Financial or American Strategic Advisors, Inc. and should not be interpreted directly or indirectly as an offer to buy or sell any securities mentioned herein. Past performance cannot guarantee future results. Investing involves risk including the potential loss of principal. No investment strategy can guarantee a profit or protect against loss in periods of declining values. Please note that individual situations can vary. Therefore, the information presented in this letter should only be relied upon when coordinated with individual professional advice. *There is no guarantee that a diversified portfolio will outperform a non-diversified portfolio in any given market environment. No investment strategy, such as asset allocation, can guarantee a profit or protect against loss in periods of declining values.
It is our goal to help investors by identifying changing market conditions. However, investors should be aware that no investment advisor can accurately predict all the changes that may occur in the market.
The price of commodities is subject to substantial price fluctuations of short periods of time and may be affected by unpredictable international monetary and political policies. The market for commodities is widely unregulated and concentrated investing may lead to Sector investing may involve a greater degree of risk than investments with broader diversification.
The opinions voiced in this material are for general information only and are not intended to provide specific advice or recommendations for any individual. All performance referenced is historical and there is no guarantee of future results. All indices are unmanaged and may not be invested into directly. Stock investments include risks, including fluctuations in market price and loss of principal. No strategy assures success or protects against loss. Because of their narrow focus, sector investing includes risk subject to greater volatility than investing more broadly across multiple sectors.