May 17, 2022
Hello Everyone,
On my last Bartometer the S&P 500 was around 4580 and I stated the market was again overbought and to Sell some equities and bonds. I stated I saw the S&P retreating to the 4200 level and if that broke then the 3800-3850 level would be the next support. Last Thursday the S&P declined to the 3840 level and bounced to the 4000 area in one day. Even though the markets are now VERY OVERSOLD and can rally a bit more, there is no major upside driver to now start a new Bull Market. Even though the market retreated so much this year, with the NASDAQ down 30% off its highs, the markets are now very oversold, but I only see minor rallies from here and more volatility until inflation and interest rates peak.
We still have the same concerns:
- High Inflation.
- Potentially Higher interest rates over the next few months.
- Potential recession in 2023.
- Potentially Slowing earnings growth.
- Putins war in the Ukraine and more.
In my opinion, any rally into the 4200 to 4400 area is still a place to consider reducing exposure to equities and bonds depending on your individual circumstances. This however is one of the worst 4.5 months we have had in a long time. As reported by Morningstar, the stock markets down anywhere from 11-50% and bonds down from 5 to 22%. Most investors are seeing their investments go down.
The only major sector that has done well recently is energy sector. Other than that, everything else is falling. Does that mean to stop investing? No, as a matter of fact, I believe the opportunities in the stock and bond markets are going to give many of you opportunities that you have not seen in a while. Dollar cost averaging can be a beneficial way to enter the markets. Consider increasing purchases over the next 1 year as the markets are lower. Warren Buffets frequently states “buy when there is blood in the streets.” There is blood in the streets now for many stocks and its possible it may get worse. Nothing is guaranteed, but if you believe in capitalism
and that great companies and markets do well over time this may become a buying opportunity. When markets are down like this you may want to take advantage of these drops. Look on page 4 to see the last 52 year of the S&P 500.
Some of the INDEXES of the markets both equities and interest rates are below. The source is Morningstar.com up until May 14, 2022 These are passive indexes.

Excerpts from Dr. Robert Genetski
Market Outlook
.
A Look Back
The bloodbath on Wall Street has taken the Nasdaq and other indexes down almost 30% from their highs.
Among the better relative performers, the S&P500 is down 18% and the Dow 14%.
Economic news is mixed. April business surveys show a sharp decline in output in China and Russia. Much of the rest of the world, including the US, continues to grow at a moderate pace amid rapid inflation.
The stock market’s technical signals remain very negative. My technical guru, Joe Bartosiewicz, CFP, wrote about major support for the S&P 500 at about 3800-3850. The index fell to a low of 3840 yesterday before rebounding to 3930. While this could be the bottom, no one can say for certain if it is.
On a positive note, the IBD ratio of bulls to bears is just about where it was in late March, 2020, during the worst fears of the Covid outbreak. Amid such extreme pessimism markets often change direction. Stocks often reflect the collective wisdom of all investors. If so, they are pointing to a much weaker economy than our forecast suggests. The key unknown is how badly shortages of food, diesel fuel and other raw materials will slow both the economy and spending. If the economy stalls or dips into a downturn, there will be some relief from inflation, but at a serious cost in jobs.
With China, Russia and Ukraine creating SupplySide problems, our forecast is for the economy to weaken this summer without going into a downturn. By the end of the summer, the economy will either be soft with continued high inflation or will be flat to down with some relief on prices. Neither scenario is very attractive. Amid all the uncertainty, my stock portfolio remains 50% in stocks and 50% in cash.
A Look Back This week’s April inflation reports showed no relief from soaring inflation. April’s total cpi index slowed to a 4% annual rate while the monthly cpi ex-food and energy increased a 7% annual rate.
Economic Fundamentals Weakening
Stock Valuation Over-Valued 19%
Monetary Policy: Expansive
Recommended Stock Exposure: 50%
This is a reduction of his stock allocation.
Dr Robert Genetski, American Strategic Advisors and LPL Financial are not affiliated. The opinions expressed in this material do necessarily reflect the views of LPL Financial.
S & P 500
Charts Source: AIQSystems.com
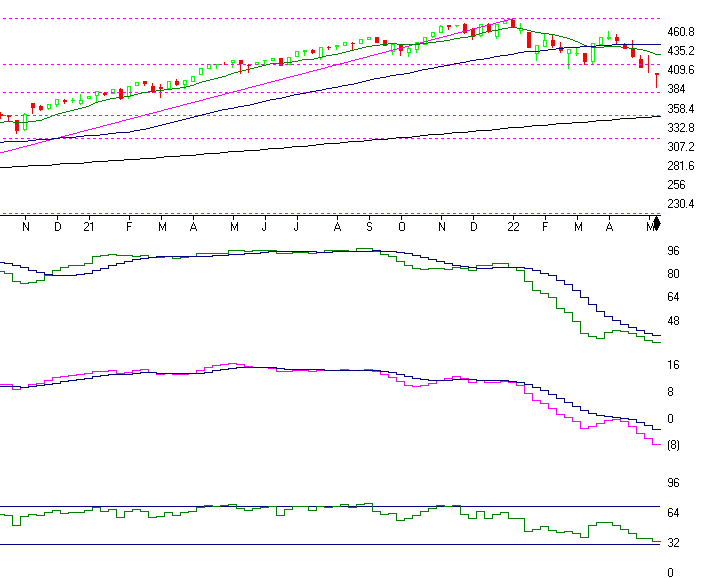
Above is the WEEKLY Chart of the S&P 500. This chart goes over the last 1.5
years in the S&P. As you can see the S&P is down about 20% off its high and down 15.2% in 2022. As you can see, I said that the 4200 level was support and if it broke that support then The 3580 to 3850 should find some buying
support. That did happen bottoming at 3840 on Thursday and closed up 2.29% on Friday, Closing at 4023.89. It has substantial Selling resistance from here to the 4200 first then 4400 area next where it can top out again. I am not thinking the S&P can start a new Bull market anytime soon. I do believe the stock market should bottom over the next year so that is why we can consider buying more equities through dollar cost averaging monthly over the next year.
SK-SD stochastics is next. This indicator was the reason I got negative last
month right near the top. This today is the weekly chart, last month was the daily chart. But last week the SK-SD Stochastics was showing an 82 reading meaning it was over bought again. Now, however it is at 16 on the Daily graph and below 32 on the weekly graph. Meaning? The markets are very
OVERSOLD and can potentially have a Rally at anytime.
Next is the MACD or Momentum graph. This shows that the momentum is engrained in a strong down trend for a while. A trend change to the upside would happen if the pink line crosses over the purple line. But as of this moment, I see volatility and a rally or two.
The last indicator is the RSI Wilder index. This is very interesting as if it breaks below the 32 line like it ALMOST IS, then the market is getting extremely oversold and we could have a major rally. It’s almost there
now.
52 YEARS OF PERFORMANCE OF THE S&P 500:
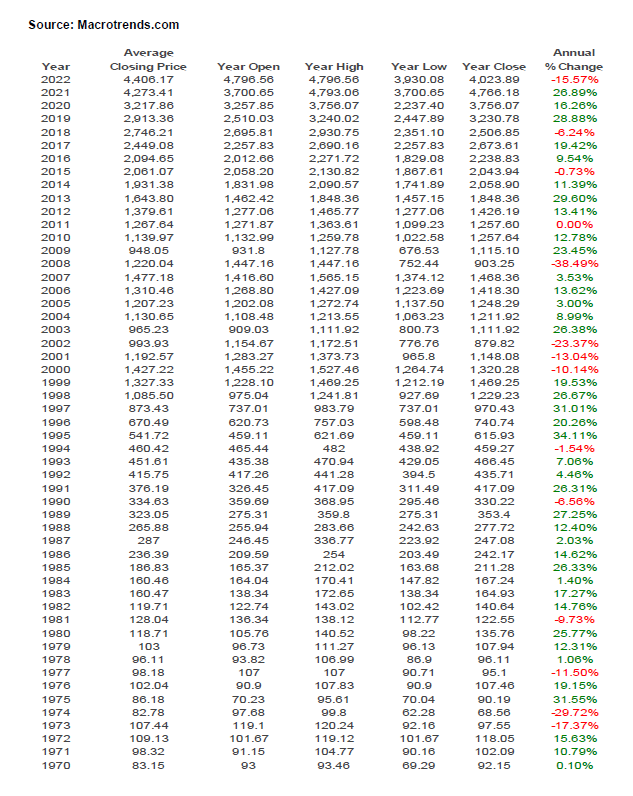
The Stock Market and INFLATION
As you can above, the S&P 500 has performed well over the long term. It has averaged an INFLATION ADJUSTED RETURN OF 6.49% according to Officialdata.org for the last 52 years. It averaged 10.66% before inflation and 6.49% after inflation. So as you can see the stock market has been one of the best ways to offset inflation over the long term. Yes, the market goes down, but over the long term it’s still one of the best places to make money.
SUPPORT AND RESISTANCE LEVELS ON THE S&P 500
SUPPORT 3800 to 3850, then 3719, 3478, and 3380. These are areas not exact numbers
RESISTANCE 4071, 4210, 4322, and 4434
Bottom Line
The market has had one of the worst 4.5 months n a few years dropping 11-50% The cause?? Overvaluation, Higher Interest rates, INFLATION, Covid and the Russian War.. If interest rates are rising and could rise 3 to 5 times like the Federal Reserve says that is why we should consider reducing regular bonds for at least another few months. At that time if interest rates peak because inflation is peaking then regular bonds may be a good investment but the only bonds I might consider are FLOATING RATE BONDS now. In addition, if interest rates rise financials potentially tend to perform better than most. In addition, stocks with pricing power and with good consistent earnings can do better than aggressive companies that have potential but no earnings. Commodities tend to do well in an inflationary environment. Look for companies with revenue growth that has the potential of beating inflation. I am still long term bullish on equities, but the short term could get very volatile where we could go a little higher on the markets but maybe back to 4500, but the downside could be the 3650 level and if we go into a soft recession then the 3300 3500 level is possible and lower if the recession is steeper. This is predicated on the actions of the Federal Reserve. I will continue to do my analysis and inform you when a bottom looks imminent.
The Best to all of you,
Joe Bartosiewicz, CFP®
Investment Advisor Representative
Contact information:
Partner Wealth Manager
American Strategic Advisors
263 Tresser Blvd Ste 100
Stamford CT 06901
860-940-7020
Disclaimer: The views expressed are not necessarily the view of LPL Financial or American Strategic Advisors, Inc. and should not be interpreted directly or indirectly as an offer to buy or sell any securities mentioned herein. Past performance cannot guarantee future results. Investing involves risk including the potential loss of principal. No investment strategy can guarantee a profit or protect against loss in periods of declining values. Please note that individual situations can vary. Therefore, the information presented in this letter should only be relied upon when coordinated with individual professional advice. *There is no guarantee that a diversified portfolio will outperform a non-diversified portfolio in any given market environment. No investment strategy, such as asset allocation, can guarantee a profit or protect against loss in periods of declining values.
It is our goal to help investors by identifying changing market conditions. However, investors should be aware that no investment advisor can accurately predict all of the changes that may occur in the market.
The price of commodities is subject to substantial price fluctuations of short periods of time and may be affected by unpredictable international monetary and political policies. The market for commodities is widely unregulated and concentrated investing may lead to Sector investing may involve a greater degree of risk than investments with broader diversification.
Indexes cannot be invested in directly, are unmanaged and do not incur management fees, costs, and expenses.
Dow Jones Industrial Average: A price weighted average of 30 significant stocks traded on the New York Stock Exchange and the NASDAQ.
S&P 500: The S&P 500 is an unmanaged indexed comprised of 500 widely held securities considered to be representative of the stock market in general.
NASDAQ: the NASDAQ Composite Index is an unmanaged, market weighted index of all over the counter common stocks traded on the National Association of Securities Dealers Automated Quotation System
(IWM) I Shares Russell 2000 ETF: Which tracks the Russell 2000 index: which measures the performance of the small capitalization sector of the U.S. equity market.
The Merrill Lynch High Yield Master Index: A broad based measure of the performance of non-investment grade US Bonds
MSCI EAFE: the MSCI EAFE Index (Morgan Stanley Capital International Europe, Australia and Far East Index) is a widely recognized benchmark of non US markets. It is an unmanaged index composed of a sample of companies’ representative of the market structure of 20 European and Pacific Basin countries and includes reinvestment of all dividends.
Investment grade bond index: The S&P 500 Investment grade corporate bond index, a sub-index of the S&P 500 Bond Index, seeks to measure the performance of the US corporate debt issued by constituents in the S&P 500 with an investment grade rating. The S&P 500 Bond index is designed to be a corporate-bond counterpart to the S&P 500, which is widely regarded as the best single gauge of large cap US equities.
Floating Rate Bond Index is a rules based, market-value weighted index engineered to measure the performance and characteristics of floating rate coupon U.S. Treasuries which have a maturity greater than 12 months.
The opinions voiced in this material are for general information only and are not intended to provide specific advice or recommendations for any individual. All performance referenced is historical and there is no guarantee of future results. All indices are unmananaged an may not be invested into directly. Stock investments include risks, including fluctuations in market price and loss of principal. No strategy assures success or protects against loss. Because of their narrow focus, sector investing includes risk subject to greater volatility than investing more broadly across multiple sectors