June 17, 2022
Hello Everyone,
We still have the same concerns:
- High Inflation.
- Potentially Higher interest rates over the next few months.
- Potential recession in 2023.
- Potentially Slowing earnings growth.
- Putins war in the Ukraine and now possibilities with China.
Inflation numbers came in last week with an annualized rate of 11%. These numbers cemented the fact that the prices are continuing to rise at an alarming pace. Now 2-3% inflation is could be good for the economy in some ways as it allows growth in prices and profits, but high rapid inflation like we have now is destructive to the economy and unless it retreats to a manageable number the Federal reserve has no other alternative but to continue to raise rates to slow the economy. Next month the Federal Reserve should raise interest rates .5 to 1% and again over the next couple of months. In my opinion they were behind the curve and should have raised rates last year but didn’t. Now they are in a quandary where instead of tapping on the brakes, they will slam on the brakes. This should cause the stock and bond markets to continue to be volatile and cause the economy to either go into a soft-landing recession, hopefully, or worse.
The S&P 500 could fall to the 3500 to 3700 falling another 10-14% if we have the soft-landing recession and 3180 if it is worse. The S&P 500 according to CNBC, is selling at 17 times this year’s earnings. This is relatively cheap, but if we go into a recession then earning revisions will go down and the Price to Earnings of the S&P 500 will go up to 18 to 20 times earnings depending on the revisions. Those revisions can drive the market down to a cheaper level. Therefore over the short-term having a little more cash in your portfolio makes sense. In addition, a reduction high flying tech stocks should be replaced by more consumer staples and solid blue-chip stocks in those sectors.
Even though I have been somewhat negative on the stock and bond markets since last November, which has not shaken me out of the idea that equities over the long term are one of the best investments in which to invest. Short term the markets go into a fall every 4 to 7 years according to CNBC. This time it is a little different when everything including bond and real estate market is falling. The only sector that has risen has been the energy sector.
I continue to be Cautious and, on any rally, you may want to sell a little of your equities depending on your risk tolerance, your goals and time horizon. But as Warren Buffet always says, “Buy when there is blood in the streets” We are not there yet as the Volatility index has not risen to panic extremes yet, but with another 5 to 10% decline they should be.
A break of 3900 should drop the S&P to 3810-3815. A break of 3810 could drop the S&P to 3700 or lower. In my opinion, a CONVINCING break of 3810 could bring the S&P 500 to the 3700 area first the 3500 too 3650 where I think market could look very interesting for BUYS but I will analyze at the time.
Overall, I feel the market will go to a new low, but aggressive and younger investors may want to use the recession and the decline to buy equities as Capitalism works and equities over the long term makes sense for most people. I do believe a reduction of equities for a time is appropriate as I feel we may hit new lows.
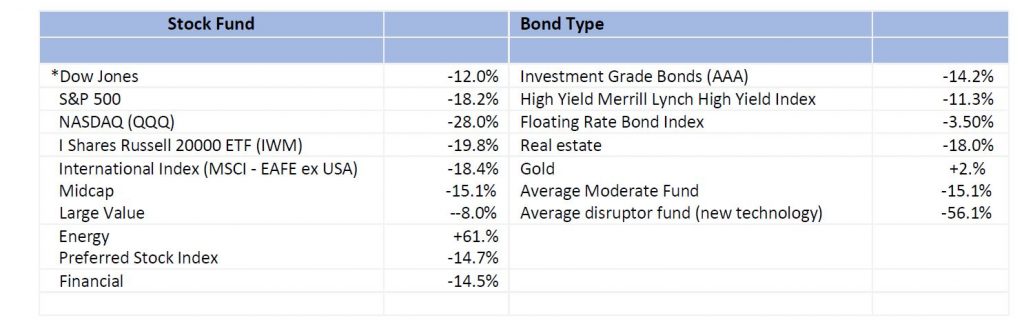
Some of the INDEXES of the markets both equities and interest rates are below.
Excerpts from Dr. Robert Genetski
Market Outlook
After two consecutive weeks of sharp increases, stock prices moved erratically lower. Although the Dow rose by 1⁄2%, the Nasdaq fell 3% and the rest of the indexes fell 1% to 2%.
The economic news was not good. Oil prices rose to $122 from $117 a week ago. Interest rates are also higher, with the 10-year Treasury yield moving above 3%. Although weekly unemployment data are highly erratic, it didn’t help that initial unemployment claims continued to rise.
For some time, the market’s technical indicators have been very negative. The latest downturn lower took out keep support areas for all key indexes. Stock prices are down 11% to 26% from their all-time highs. Technical indicators point to likely further loses.
This remains a highly risky environment for stocks, particularly with the Fed intending to restrict the money supply. If the Fed is successful in reducing the amount of money in the economy, it will drive interest rates higher and drive stock prices still lower. The combination of an overvalued stock market, weak technical indicators and the Fed’s attempt to restrict money provide for a highly risky environment for stocks. With these elevated risks, I’m increasing the cash portion of my portfolio and suggest you do the same.
A Look Back
Today’s inflation report shows May consumer prices increased at an 11% annual rate from April; core inflation rose at a 6% rate. The yearly increases were 9% for all prices and 6% for prices ex-food and energy.
With energy prices soaring in June, and with business surveys showing little in the way of relief, the Fed will be under pressure to become even more aggressive in its efforts to adopt higher interest rates and sell securities.
Economic Fundamentals Weakening
Stock Valuation Over-Valued 24%
Monetary Policy: Expansive
Recommended Stock Exposure: 25%
This is a reduction of his stock allocation.
Dr Robert Genetski, American Strategic Advisors and LPL Financial are not affiliated. The opinions expressed in this material do necessarily reflect the views of LPL Financial.
S&P 500
Chart source AIQ Systems
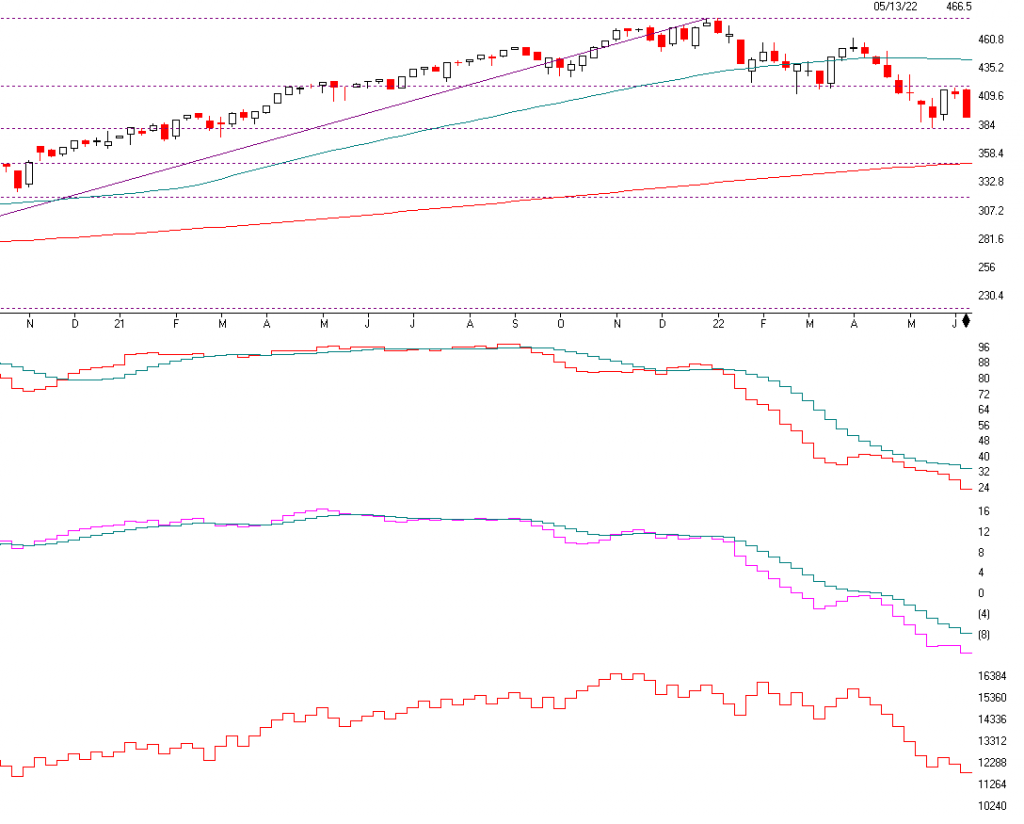
Above is the S&P 500. It is currently down 18.2% for the year and
the NASDAQ is now down 28%. There is currently minor buying support at 3810-3815, if that breaks and I think there is a good possibility of breaking that level over the next few days or weeks the 3700, is minor support then the 200-day moving average of 3500-3644 is MAJOR SUPPORT This is also the 50% Fibonacci Retracement so this level is very important and good support. It would also be Wave 5 of Elliott Wave Theory which could be the bottom over the next few months. If we go into a larger Recession then the 61.8% Fibonacci Ratio or 3180 would be the lowest decline I see. On the upside if 4200 to 4400 happens over the next 3 months then I would sell into that level.
Next are three indicators that are important to determine over bought or oversold levels.
The first is SK-SD Stochastics. When the levels of 32 is broken then the market is OVERSOLD, and it is currently, but it still doesn’t mean its cheap, It just means it’s over sold and could bounce.
The next indicator is momentum or MACD. This is how this indicator works. When the pink line crosses above or below the aqua line it’s a BUY or SELL. Notice it has been on a SELL since January,
The last indicator is On Balance Volume. This is a very powerful indicator which shows when the markets are confirming the upside or downside. As the markets goes down if there is more volume when the market is falling then indicator will fall more and that is very negative as it confirms the downside. Notice the black line is trending down when the market is going horizontal above. This is negative.
SUPPORT AND RESISTANCE LEVELS ON THE S&P 500
SUPPORT 3810 t0 3815 then 3700, 3645, 3506 the 50% Fibonacci Retracement, 3195 the 61.8% Fibonacci Retracement. These are areas not exact numbers
RESISTANCE 4178, 4224, 4322, and 4434
Bottom Line
The market has had one of the worst years in a long time dropping 18-55% The cause?? Overvaluation, Higher Interest rates, INFLATION, Recessionary pressures, Covid and the Russian War and China. If interest rates are rising and could rise 3 to 5 times like the Federal Reserve says that is why we should consider reducing regular bonds for at least another few months. At that time if interest rates peak because inflation is peaking then stocks and regular bonds may be a worthwhile investment. In addition, stocks with pricing power and with good consistent earnings can do better than
aggressive companies that have potential but no earnings. Commodities tend to do well in an inflationary environment. Look for companies with revenue growth that has the potential of beating inflation. I am still long term bullish on equities, but the short term could get very volatile over the next 2 to 4 months. The upside might be 4178 to 4400, but I would Sell some if it goes there over the next 2 months but the downside could be the 3650 level if we go into a soft recession then the 3180 to 3200 is possible if the recession is steeper. At that point the markets could be a great buying opportunity. This is predicated on the actions of the Federal Reserve. I will continue to do my analysis and inform you when a bottom looks imminent.
The Best to all of you,
Joe Bartosiewicz, CFP®
Partner Wealth Manager
American Strategic Advisors
263 Tresser Blvd Ste 100
Stamford CT 06901
860-940-702
SECURITIES AND ADVISORY SERVICES OFFERED THROUGH LPL Financial, a registered investment advisor, MEMBER FINRA/SIPC.
Charts provided by AIQ Systems:
Disclaimer: The views expressed are not necessarily the view of LPL Financial or American Strategic Advisors, Inc. and should not be interpreted directly or indirectly as an offer to buy or sell any securities mentioned herein. Past performance cannot guarantee future results. Investing involves risk including the potential loss of principal. No investment strategy can guarantee a profit or protect against loss in periods of declining values. Please note that individual situations can vary. Therefore, the information presented in this letter should only be relied upon when coordinated with individual professional advice. *There is no guarantee that a diversified portfolio will outperform a non-diversified portfolio in any given market environment. No investment strategy, such as asset allocation, can guarantee a profit or protect against loss in periods of declining values.
It is our goal to help investors by identifying changing market conditions. However, investors should be aware that no investment advisor can accurately predict all of the changes that may occur in the market.
The price of commodities is subject to substantial price fluctuations of short periods of time and may be affected by unpredictable international monetary and political policies. The market for commodities is widely unregulated and concentrated investing may lead to Sector investing may involve a greater degree of risk than investments with broader diversification.
Indexes cannot be invested in directly, are unmanaged and do not incur management fees, costs, and expenses.
Dow Jones Industrial Average: A price weighted average of 30 significant stocks traded on the New York Stock Exchange and the NASDAQ.
S&P 500: The S&P 500 is an unmanaged indexed comprised of 500 widely held securities considered to be representative of the stock market in general.
NASDAQ: the NASDAQ Composite Index is an unmanaged, market weighted index of all over the counter common stocks traded on the National Association of Securities Dealers Automated Quotation System (IWM) I Shares Russell 2000 ETF: Which tracks the Russell 2000 index: which measures the performance of the small capitalization sector of the U.S. equity market.
The Merrill Lynch High Yield Master Index: A broad based measure of the performance of non-investment grade US Bonds
MSCI EAFE: the MSCI EAFE Index (Morgan Stanley Capital International Europe, Australia and Far East Index) is a widely recognized benchmark of non US markets. It is an unmanaged index composed of a sample of companies’ representative of the market structure of 20 European and Pacific Basin countries and includes reinvestment of all dividends.
Investment grade bond index: The S&P 500 Investment grade corporate bond index, a sub-index of the S&P 500 Bond Index, seeks to measure the performance of the US corporate debt issued by constituents in the S&P 500 with an investment grade rating. The S&P 500 Bond index is designed to be a corporate-bond counterpart to the S&P 500, which is widely regarded as the best single gauge of large cap US equities.
Floating Rate Bond Index is a rules based, market-value weighted index engineered to measure the performance and characteristics of floating rate coupon U.S. Treasuries which have a maturity greater than 12 months.
The opinions voiced in this material are for general information only and are not intended to provide specific advice or recommendations for any individual. All performance referenced is historical and there is no guarantee of future results. All indices are unmanaged an may not be invested into directly. Stock investments include risks, including fluctuations in market price and loss of principal. No strategy assures success or protects against loss. Because of their narrow focus, sector investing includes risk subject to greater volatility than investing more broadly across multiple sectors.
.