As the primary currency recognized around the globe, the U.S. Dollar is pretty important. And the trend of the dollar is pretty important also. While a strong dollar is good in terms of attracting capital to U.S. shores, it makes it more difficult for U.S. firms that export goods. One might argue that a “steady” dollar is generally preferable to a very strong or very weak dollar.
Speaking of the trend of the dollar, a lot of things move inversely to the dollar. In fact, one can typically argue that as long as the dollar is strong, certain “assets” will struggle to make major advances. These include – commodities in general, metals specifically, foreign currencies (obviously) and international bonds (strongly).
Let’s first take a look at the state of the dollar.
Ticker UUP
For our purposes we will use the ETF ticker UUP ( Invesco DB US Dollar Index Bullish Fund) to track the U.S. Dollar. Figure 1 displays a monthly chart and suggests that UUP just ran into – and reversed at least for now – in a significant zone of resistance.
Which way will things go? It beats me. But I for one will be keeping a close eye on UUP versus the resistance levels highlighted in Figures 1 and 2. So will traders of numerous other securities.
Inverse to the Buck
Figure 4 displays the 4-year weekly correlation for 5 ETFs to ticker UUP (a correlation of 1000 means they trade exactly the same a UUP and a correlation of -1000 means they trade exactly inversely to UUP).
In the following charts, note the inverse relationship between the dollar (UUP on the bottom) and the security in the top chart. When the dollar goes way down they tend to go way up – and vice versa.
Note also that in the last year several of these securities went up at the same time the dollar did. This is a historical anomaly and should not be expected to continue indefinitely.
Figure 8 – Ticker BWX (SPDR Bloomberg Barclays International Treasury Bond) vs. UUP (Courtesy AIQ TradingExpert )
Figure 9 – Ticker IBND (SPDR Bloomberg Barclays International Corporate Bond) vs. UUP (Courtesy AIQ TradingExpert )
Figure 10 – Ticker FXE (Invesco CurrencyShares Euro Currency Trust) vs UUP (Courtesy AIQ TradingExpert )
Summary
If the dollar fails to break out of it’s recent resistance area and actually begins to decline then commodities, currencies, metals and international stocks and bonds will gain a favorable headwind. How it all actually plays out, however, remains to be seen.
So keep an eye on the buck. Alot is riding on it – whichever way it goes.
Jay Kaeppel
Disclaimer: The data presented herein were obtained from various third-party sources. While I believe the data to be reliable, no representation is made as to, and no responsibility, warranty or liability is accepted for the accuracy or completeness of such information. The information, opinions and ideas expressed herein are for informational and educational purposes only and do not constitute and should not be construed as investment advice, an advertisement or offering of investment advisory services, or an offer to sell or a solicitation to buy any security.
Technology is what it’s all about these days. Technology (primarily) runs on semiconductors. If the semiconductor business is good, business is good. OK, that’s about as large a degree of oversimplification as I can manage. But while it may be overstated, there is definitely a certain amount of truth to it.
So, it can pay to keep an eye on the semiconductor sector. The simplest way to do that is to follow ticker SMH. Keeping with the mode of oversimplifying things, in a nutshell, if SMH is not acting terribly that’s typically a good thing. So where do all things SMH stand now? Let’s take a look.
Ticker SMH
As with all things market-related (among other things), beauty is in the eye of the beholder. A quick glance at Figure 1 argues that SMH is inarguably in a strong uptrend, well above its 200-day moving average
A glance at Figure 2 suggests that SMH has just completed 5 waves up and may be due for a decline.
Figure 2 – SMH with potentially bearish Elliott Wave count (Courtesy ProfitSource by HUBB)
And Figure 3 highlights a very obvious bearish divergence between SMH weekly price action and the 3-period RSI indicator – i.e., SMH keeps moving incrementally higher while RSI3 reaches slightly lower highs each time. Speaking anecdotally, this setup seems to presage at least a short-term decline maybe 70% of the time. Of course, the degree of decline varies also.
So, what does it all mean? First off, I am not going to make any predictions (if you knew my record on “predictions” you would thing that that is a good thing). I am simply going to point out that one way or the other SMH may be about to give us some important information.
Scenario 1 – SMH breaks out to the upside and stays there: If SMH breaks through the upside and runs, the odds are very high that the overall stock market will run with it.
Course of action: Play for a bullish run by the overall market into the end of the year.
Scenario 2 -SMH breaks out briefly to the upside but then falls back below the recent highs: This would be at least a short-term bearish sign. Failed breakouts are typically a bad sign and the security in question often behaves badly after disappointing bullish investors. In this case, if it happens to SMH it could follow through to the overall market.
Course of action: If this happens, you might consider “playing some defense” (hedging, raising some cash, etc.) . Failed breakouts often make the market a little “cranky” (and cranky is one of my fields of expertise).
Scenario 3: SMH fails to breakout and suffers an intermediate-term decline. If I were to fixate only on the bearish RSI3 divergence I showed earlier in Figure 3, this would seem like the most likely result.
Course of action: If SMH sells off without breaking above recent resistance, keep an eye on SMH price via its 200-day moving average. Simple interpretation goes like this: If SMH sells off but holds or regains it’s 200-day moving average then the bullish case can quickly be re-established; If SMH sells off and holds below its 200-day moving average, that should be considered a bearish sign for the overall market.
Jay Kaeppel
Disclaimer: The data presented herein were obtained from various third-party sources. While I believe the data to be reliable, no representation is made as to, and no responsibility, warranty or liability is accepted for the accuracy or completeness of such information. The information, opinions and ideas expressed herein are for informational and educational purposes only and do not constitute and should not be construed as investment advice, an advertisement or offering of investment advisory services, or an offer to sell or a solicitation to buy any security.
Market Recap: Over the last month, the market has gone down about 4%, then rebounded nearly 3% to a slight decline of 1% over the previous month. The continual news of the Impeachment, slower orders on manufacturing, and the Chinese tariff discussions have made the market more volatile. October is usually a bottoming month, and November and December are traditionally higher. Last year, this did not happen. The market bottomed on December 26, 2018, and surged from that date to July with a return of 21% from January to July 2019.
An excerpt from Fundamental Economist Dr. Robert Genetski: from Classical Principles.com:
“This week’s main positive event was Fed Chairman Powell’s indication that the Fed would resume purchasing securities. Assuming the Fed follows through, this represents a game-changer in terms of next year’s economy and conditions of the nearterm outlook for stocks. Another potential positive development is Trump’s view that talks regarding a trade agreement are going well. I continue to expect a limited deal as a first step in improving trade with China. The rise in stock futures last Friday indicates that investors expect an agreement”.
Adding to Bob’s his Comment:
With or without a trade agreement, the outlook for stocks has improved with Powell’s comments. Purchases of securities improve the odds the economy will do very well next year. If it does, there’s a better chance of avoiding a destructive move toward socialist policies. Stocks are still subject to a decline if there is a failure to reach a trade agreement. However, monetary policy is more important. Without sufficient money, the economy would decline even with a trade agreement. While the Fed’s purchases of securities won’t impact the economy until the spring, they should impact both stocks and interest rates almost immediately. The Fed’s decision to purchase securities provides a reason to move to a fully invested position in equity portfolios.
On the Technical Side:
Over the last almost two years, the markets haven’t done much at all. (See the Monthly Chart below). The markets have been volatile after the prior seven-year run. Earnings have been soft, but the markets seem to want to go higher. The stock market NEEDs to BREAKOUT of the old highs of the Dow Jones at 27400, S&P 500 at 3029, and the NASDAQ 8340. The markets are only about 1 to 2% from a Major Breakout. But it needs the volume and conviction of more certainty in the Chinese trade agreement and the economy that has been showing some signs of a slowing. Earnings have been slowing so we are at a critical point in the markets again. October can be a volatile month, so it is vital that if the markets don’t breakout soon it will cause sellers and traders to start the selling again. If the Dow closes below 25740, I will be getting Cautious, and 25335. I will be Getting Very Cautious.
Some of the INDEXES of the markets both equities and interest rates are below. The source is Morningstar.com up until October 11th, 2019.
Dow Jones +17% S&P 500 +20% NASDAQ Aggressive growth +24% I Shares Russell 2000 ETF (IWM) Small cap +13% International Index (MSCI – EAFE ex USA) +13% Moderate Mutual Fund +10% Investment Grade Bonds (AAA) +11%
High Yield Merrill Lynch High Yield Index +9%
Floating Rate Bond Index +3-5% Short Term Bond +3% Fixed Bond Yields (10 year) +1.72.% Yield
The average Moderate Fund is up 10% this year fully invested as a 60% in stocks and 40% in bonds and nothing in the money market.
Interest Outlook I see the Federal Reserve reducing interest rates ¼% in December.
The Dow Jones Index is above. As it contains 30 of the largest industrial and American stocks. I wanted to show you the 10 year performance and the LONG TERM of the Dow Jones. Notice that the Dow has done very well from 2010 until 1/31/2018. Since then the Dow Jones has gone up and down and is up about 1% in about 2 years. It is right near its old high of the last 1.9 years. There are three indicators above that are important. The first one is the MACD and or Momentum index. As you can see from the index is that it has lost momentum. See the index drifting lower. This shows that the market have lost the upside breakout push. It needs the volume push upward and it needs volume and good news from the government to push it higher and break out to push it above the 27400.
There are two indicators that look GOOD The Money Flow Indicator is at a new high as well as the On Balance Volume Indicator. These indicators are important to determine where the overall market is headed. When both of them are at new highs but the market is not at a new high it shows that there is DEMAND for stocks. It’s not guaranteed that the market will breakout but is a pretty good indicator that it will. With all of the Tweeting and volatility in the market this is not a greatest of indicators but it is more accurate without all of the volatile news. There is a somewhat of a Bullish patter above called an Ascending Triangle. It shows a rise of the trend line and that is bullish. See the vertical blue arrow pointing upward. This will many time breakout to the UPSIDE. But if the Dow Jones closes below 25740 I will be getting Cautious and if it breaks below 25335 on a close I will be getting Very Cautious.
Support levels on the S&P 500 area are 2916, 2823, 2746, and 2921. These might be BUY areas.
Support levels on the NASDAQ are 7967, 7782, 7644, and 7407. On the Dow Jones support is at 26,285, 25,763, and 25,458 These may be safer areas to get into the equity markets on support levels slowly. RESISTANCE LEVEL ON THE S&P 500 IS 30280 Dow Jones breakout is 27,400. If there is a favorable tariff settlement, the market should rise short term.
THE BOTTOM LINE:
The Dow, the S&P 500 and the NASDAQ are all near new highs after rallying over the last two weeks. Since then, the markets have rallied near their old highs. There are technical patterns that show the markets could breakout to new highs, but IF THE MARKETS DON’T BREAKOUT OUT SOON, THE MARKETS COULD TOP OUT. I WILL CONTINUE TO ANALYZE THE TECHNICALs OF THE MARKET.
There are seasonal patterns that are usually weak. October is NOT SEASONALLY strong. It’s often a bottoming month. It looks like the market wants to go up, but with tweets coming out hourly, market timing will be more difficult. If things come in as Trump expects, watch for a substantial rally possibly to the old highs. But there are headwinds currently short term.
Best to all of you,
Joe Bartosiewicz, CFP® Investment Advisor Representative Contact information:
5 Colby Way Avon, CT 06001 860-940-7020 or 860-404-0408
SECURITIES AND ADVISORY SERVICES OFFERED THROUGH SAGE POINT FINANCIAL INC., MEMBER FINRA/SIPC, AND SEC-REGISTERED INVESTMENT ADVISOR.
Charts provided by AIQ Systems:
Technical Analysis is based on a study of historical price movements and past trend patterns. There is no assurance that these market changes or trends can or will be duplicated shortly. It logically follows that historical precedent does not guarantee future results. Conclusions expressed in the Technical Analysis section are personal opinions: and may not be construed as recommendations to buy or sell anything.
Disclaimer: The views expressed are not necessarily the view of Sage Point Financial, Inc. and should not be interpreted directly or indirectly as an offer to buy or sell any securities mentioned herein. Securities and Advisory services offered through Sage Point Financial Inc., Member FINRA/SIPC, an SEC-registered investment advisor. Past performance cannot guarantee future results. Investing involves risk, including the potential loss of principal. No investment strategy can guarantee a profit or protect against loss in periods of declining values. Please note that individual situations can vary. Therefore, the information presented in this letter should only be relied upon when coordinated
The Dow was up a snap back from the prior fall into the close? We downloaded the snapshot 90 minutes into the trading day. This video shows what we found, and how you can use this to get ahead of the rest of the market.
The fastest way to browse hundreds of charts end of day is back with a vengeance. AIQ TradingExpert Pro has always been known for its ability to browse hundreds of daily price charts at blizzard speeds (one of the many unique features in the platform).
The fastest way to browse hundreds of charts end of day is back with a vengeance. AIQ TradingExpert Pro has always been known for its ability to browse hundreds of daily price charts at blizzard speeds (one of the many unique features in the platform).
Also includes historical data on US and Canadian stocks updated every night and Mutual Fund NAVs updated each night.
How do traders use this powerful data?
For the Chart Pattern Recognition traders this is the Ferrari of analysis tools. It’s simple to scan hundreds of charts to see the patterns emerging the same day it’s happening.
For traders who look for groups or sectors on the move, our intraday snapshot updates AIQ’s powerful groups and sectors too, so you can get ahead of a move in the market segments before the rest of the crowd.
For traders who want to place trades in the last hour of the trading day, downloading a snapshot in the last hour of trading day has almost the entire days action for your stocks, you can do your end of day analyze and place tomorrows trades today.
PLUS all the powerful features of AIQ TradingExpert Pro end of day including
AI-based Signals Uncover Hidden Trades – Award winning AI-based expert system screens for trading candidates that may have been missed by other systems, giving you an edge.
Time Saving Analysis with Chart Barometer – Our Indicator Barometer gives you an instant evaluation of the status of all indicators for each chart. Saving you time and allowing an easy to read analysis of any ticker.
Every Chart your way with Custom Layouts – Whether you prefer price bar, candlestick, or point and figure charts, we’ve got them. Plus, TradingExpert Pro delivers all the trendline and drawing tools that you expect in a top end package, including Fibonacci Studies, Gann Fans, and Regression Lines.
Time Saving Power! 200 Screening Reports – TradingExpert Pro automatically performs millions of computations and delivers instant access to one and two-page reports highlighting trading candidates for stocks, indexes, mutual funds, groups and sectors and more. Want to find tickers in a trend? We got it. Relative strength? Upside and downside at your fingertips. Volume Spikes, Persistence of Money Flow, Price Gap, Point and Figure Breakouts and many many more……All generated each day automatically…
Building a Trading System just got a Whole lot Easier – TradingExpert Pro provides an amazing way to design, test, and automate virtually any trading idea. It’s called the Expert Design Studio and is considered by traders to be the best tool of its kind. That’s because it combines a point-and-click interactive trading library with state-of-the-art back testing and gives you the ability to produce custom screening reports. PLUS our Pre-built strategies have been fine-tuned by our analysts to produce outstanding results. They include Growth, Divergence, Short Selling, Day Trading, and Bottom Fishing models, to name just a few.
Complete Array of Analysis Tools – TradingExpert Pro’s Proven Market Timing “too good to ignore.” Introduced in 1986, AIQ’s market timing system called the Crash of ‘87 and has called all major market moves since. Its multi-indicator, rule-based approach for determining market direction is time proven.
AND TradingExpert Pro also includes:
Professional Level Portfolio Management
Matchmaking Correlation tools
Automate Your Winning Systems with Portfolio Simulation Tools
Also includes historical data on US and Canadian stocks updated every night and Mutual Fund NAVs updated each night.
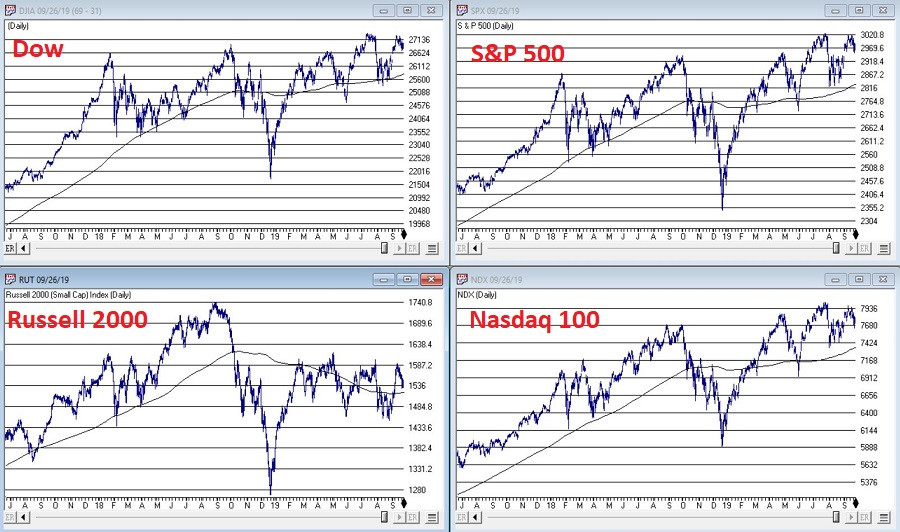
As usual, you can pretty much see whatever you want to see in today’s stock market. Consider the major indexes in Figure 1, displayed along with their respective 200-day moving averages.
If you “want to” be bullish, you can focus on the fact that all 4 of these major indexes are presently above their respective 200-day moving averages. This essentially defines an “uptrend”; hence you can make a bullish argument.
If you want to be “bearish”, you can focus on the “choppy” nature of the market’s performance and the fact that very little headway has been made since the highs in early 2018. This “looks like” a classic “topping pattern” (i.e., a lot of “churning”), hence you can make a bearish argument.
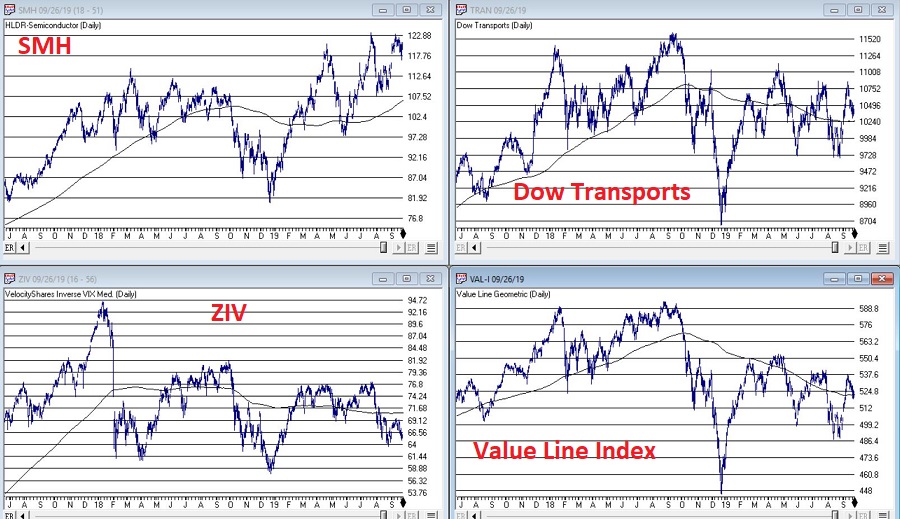
To add more intrigue, consider the 4 “market bellwethers” displayed in Figure 2.
(NOTE: Previously I had Sotheby’s Holdings – ticker BID – as one my bellwethers. As they are being bought out, I have replaced it with the Value Line Arithmetic Index, which has a history of topping and bottoming prior to the major indexes)
The action here is much more mixed and muddled.
*SMH – for any “early warning” sign keep a close eye on the semiconductors. If they breakout to a new high they could lead the overall market higher. If they breakdown from a double top the market will likely be spooked.
*TRAN – The Dow Transports topped out over a year ago and have been flopping around aimlessly in a narrowing range. Not exactly a bullish sign, but deemed OK as long as price holds above the 200-day moving average.
*ZIV – Inverse VIX is presently below it’s 200-day moving average, so this one qualifies as “bearish” at the moment.
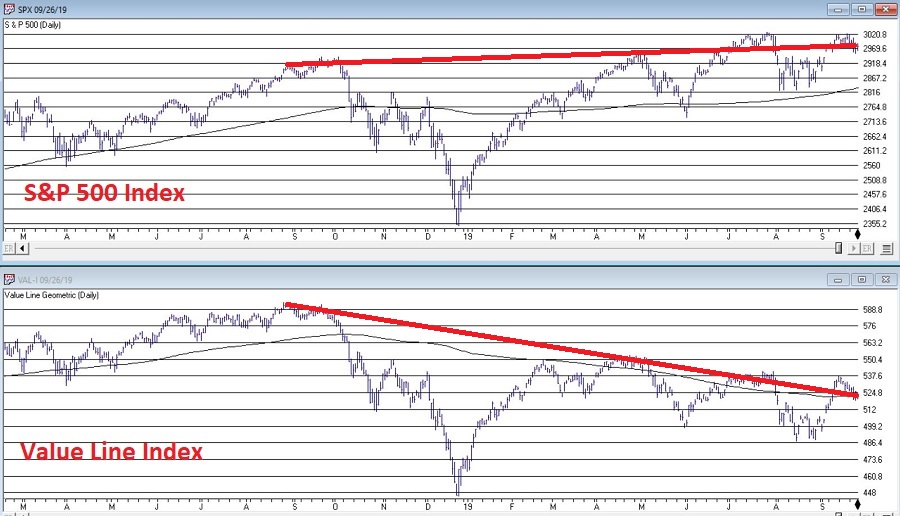
*VAL-I – The Value Line Index is comprised of 1,675 stocks and gives each stock equal weight, so is a good measure of the “overall” market. It presently sits right at its 200-day moving average, however – as you can see in Figure 3 – it is presently telling a different story than the S&P 500 Index.
Figure 3 – S&P 500 trending slightly higher, Value Line unweighted index trending lower (Courtesy AIQ TradingExpert)
The Bottom Line
OK, now here is where a skilled market analyst would launch into an argument regarding which side will actually “win”, accompanied by roughly 5 to 50 “compelling charts” that “clearly show” why the analysts’ said opinion was sure to work out correctly. Alas, there is no one here like that.
If the question is, “will the stock market break out to the upside and run to sharply higher new highs or will it break down without breaking out to new highs?”, I sadly must default to my standard answer of, “It beats me.”
Here is what I can tell you though. Instead of relying on “somebody’s opinion or prediction” a much better bet is to formulate and follow an investment plan that spells out:
*What you will (and will not) invest in?
*How much capital you will allocate to each position?
*How much risk you are willing to take with each position?
*What will cause you to exit with a profit?
*What will cause you to exit with a loss?
*Will you have some overarching “trigger” to cause you to reduce overall exposure?
*And so on and so forth
If you have specific answers for the questions above (you DO have specific answers, don’t you?) then the correct thing to do is to go ahead and follow your plan and ignore the myriad prognostications that attempt to sway you one way or the other.
Jay Kaeppel
Disclaimer: The data presented herein were obtained from various third-party sources. While I believe the data to be reliable, no representation is made as to, and no responsibility, warranty or liability is accepted for the accuracy or completeness of such information. The information, opinions and ideas expressed herein are for informational and educational purposes only and do not constitute and should not be construed as investment advice, an advertisement or offering of investment advisory services, or an offer to sell or a solicitation to buy any security.