Date & Time July 24, 2023 05:00 PM Eastern
An hour-long session with Steve Hill, CEO of AIQ Systems. It’s one of the longest-running AI-based systems in the world. Like any AI it isn’t perfect. In this session, Steve will cover leveraging these ratings for effective trading decisions.

As every investor knows, in stock market trading, timing is everything. AIQ is the world leader in producing artificial intelligence-based expert systems for stock market timing for use on personal computers.
Briefly, an expert system is a decision-making system that contains the knowledge of experts on a particular subject, and uses this knowledge to make decisions and solve problems. To create an expert system, a knowledge engineer researches experts in a particular field and distills their knowledge and insight into a series of rules. By following the rules, the expert system can analyze a problem and solve it.
AIQ TradingExpert Pro is programmed with the knowledge and insight of respected technical analysts, experts who have developed technical analysis indicators and systems for the last 50 years. The up/down timing signals issued by TradingExpert Pro are based on this knowledge. Since TradingExpert Pro’s timing signals are generated on a scientific basis, free of bias or emotion, you get a disciplined, objective approach to stock market timing.
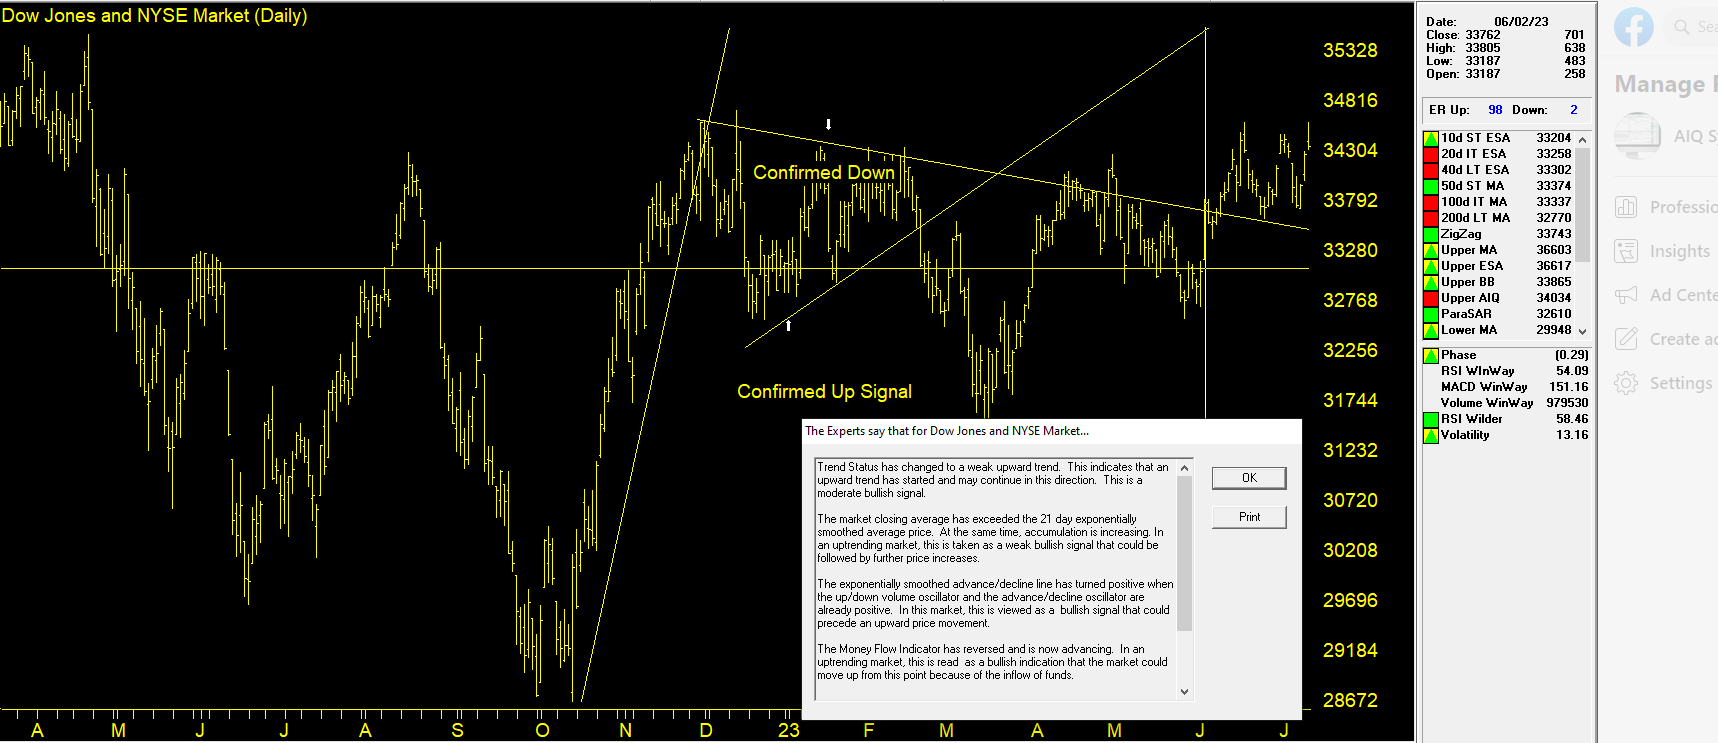
The timing signals produced by the AIQ expert system are in the form of Expert Ratings Behind each Expert Rating is a set of rules that combine the sound principles of technical analysis with the experience of market professionals. Since no single technical indicator works all the time, using indicators in combination increases their reliability. For example, a rule is developed that combines the readings of two or more indicators. This rule is then more reliable than the reading of a single indicator.
Within TradingExpert Pro are two knowledge bases, one specifically designed to issue market timing signals and the other designed to issue stock timing signals. Each TradingExpert Pro knowledge base contains approximately 400 rules, but only a few “fire” on any given day. In the language of expert systems, those rules that are found to be valid on a particular day are described as having “fired”.
Rules can fire in opposite directions. When this happens, the bullish and bearish rules fight it out. It’s only when bullish rules dominate that the Expert Rating signal is bullish, or when bearish rules dominate that the Expert Rating signal is bearish.