February 7, 2021
Hello Everyone,
The stock market again continues its upward trend, but instead of the large stocks powering the markets higher, its been the small caps, up 13% since January 1. Over the last 4 Bartometers, I have been recommending a shift to small and midcap stocks, and they are now performing the best. I still like the small, midcap, and larger companies, but as long as the economy grows, the small and midcap stocks should continue to do relatively well. I am not saying that the larger companies won’t grow, but the market is now 16% overvalued based on interest rates and future projected growth. For the aggressive investor over the long term, I like the Block Chain technology sector, the new internet of things, the autonomous car sector, technology, and biotechnology for the dramatic growth potential ahead. As we come out of the Covid-19 malaise, the airlines, restaurants, amusement parks, cruise ships, real estate, and manufacturing, and more should rebound. I also see the fuel cell technology, international emerging markets, and international in general doing well. My computer models are still on a Hold signal but can change at any time as the market is very overbought,
A year from now, I anticipate the economy will be healthier than the current status. The more robust economy will be in part due to the availability of COVID vaccines from Pfizer, Moderna, and J&J and benefiting other hard-hit companies.
Some of the INDEXES of the markets both equities and interest rates are below. The source is Morningstar.com up until February 07, 2021. These are passive indexes.
Dow Jones
+1.92%
S&P 500
+3.70%
EQUAL WEIGHTED S&P 500
+4.50%
NASDAQ Aggressive growth
+5.62%
Large Cap Value
+3.00%
I Shares Russell 2000 ETF (IWM) (Small-Cap)
+13.05%
Midcap stock funds
+7.52%
International Index (MSCI-EAFE ex USA)
+2.50%
Financial Stocks
+9.00%
Energy Stocks
+10.0%
Healthcare Stocks
+11.0%
Moderate Mutual Funds Investment Grade Bonds (AAA) Long Duration
+2.22%
High Yield Merrill Lynch High Yield Index
+0.30%
Floating Rate Bond
+0.70%
Short-Term Bond
+0.40%
Multi sector bond funds
+0.59%
Gold
-4.70%
10-year Bond Yield
1.00%
Classicalprinicples.com and Robert Genetskis Excerpts
Market Outlook
There was a combination of good news this week adding to the latest euphoria surrounding stocks. Positive news on economic growth, robust earnings reports, a sharp decline in COVID-19 cases, and progress in distributing the vaccine all helped lift stock prices.
The increase lifted the S&P500 back to 16% above its fundamental value. In my upcoming monthly report, we’ll look at how monetary policy has contributed to ending bull markets and highlight some of the early warning signals. At this time monetary policy continues to provide a strong tailwind for stocks. While investors are prone to react to any negative news, the tailwind from monetary policy should continue to limit any downward moves.
During the first half of this year the economy’s momentum should enable it to grow at an annual rate 4% or higher. Growth is likely to slow later this year and into the next year as new policies slow the economy’s upward momentum.
As the chart above shows, long-term interest rates have begun to move higher. Without the Fed’s manipulation, the yield on 10-Treasury Notes would likely be near 4%. As the economy heats up and inflation increases, we face the potential for a major increase in interest rates.
A Look Back
Today’s jobs report shows private industries added a net of only 6,000 jobs in January. There was a loss of 61,000 jobs in leisure and hospitality, an improvement from the loss of 531,000 in December. A sharp rise in government employment led to the gain of 49,000 total jobs.
In spite of the weakness in jobs, ISM business surveys for January show rapid growth in both manufacturing and service companies. Readings were in the high 50s. New orders were even stronger with readings in the low 60s.
Stock Valuation: S&P 500 16% Overvalued
Economic Fundamentals: Positive
Monetary Policy; Highly Expansive
.
Source: Classical Principles.com
NASDAQ
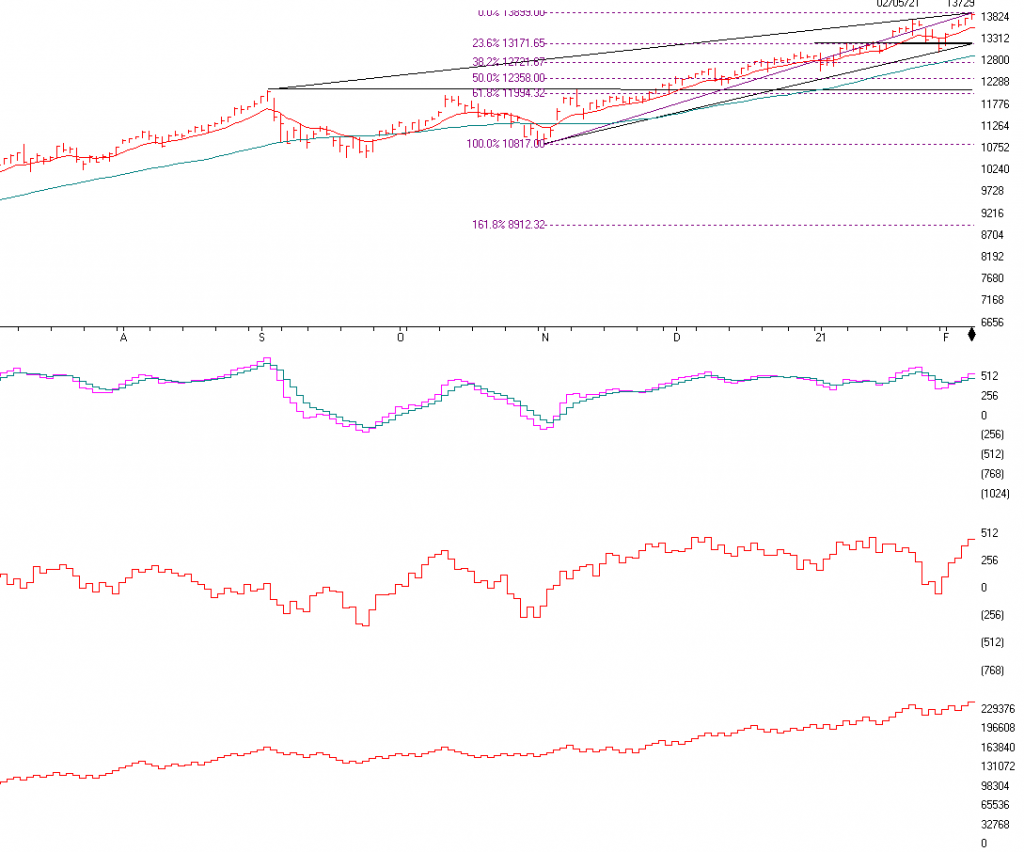
The NASDAQ is above and it contains the stocks like Apple Computer, Amazon, Microsoft, Shopify, Tesla and much more. This is the index that has been the growth engine of the markets over the last 10 years and I believe it should continue to grow over the long term. Short-term there is support at 13,171 to 13,200 right at the bottom Trend-line and the 23.6% Fibonacci Retracement If the NASDAQ breaks and closes BELOW 13171 I will become CAUTIOUS TO VERY CAUTIOUS ON THE MARKET as it is very overvalued at this time. I am however, still relatively Bullish but understand that market direction changes on a dime. If 13,171 breaks there is support at the 12,900 area or the 50-day moving average. If the NASDAQ closes below that Level I will become VERY CAUTIOUS and would expect the NASDAQ to fall to the 12,141 area. So, observance is now important. I am still bullish, but I realize the markets are now Very Overvalued.
Momentum is still positive as you can see the pink line above the blue line.
The ADVANCE – DECLINE Line is next. It shows the number of stocks going up as compared to the number of stocks going down on a running total and you can see it still looks relatively positive
On-Balance Volume is the last chart. This is confirming the upside as well and not showing any divergence or non- confirmation. It is confirming the upside as it is at a new high and so is the NASDAQ. Please call me at 860-940-7020 with questions.
S&P 500
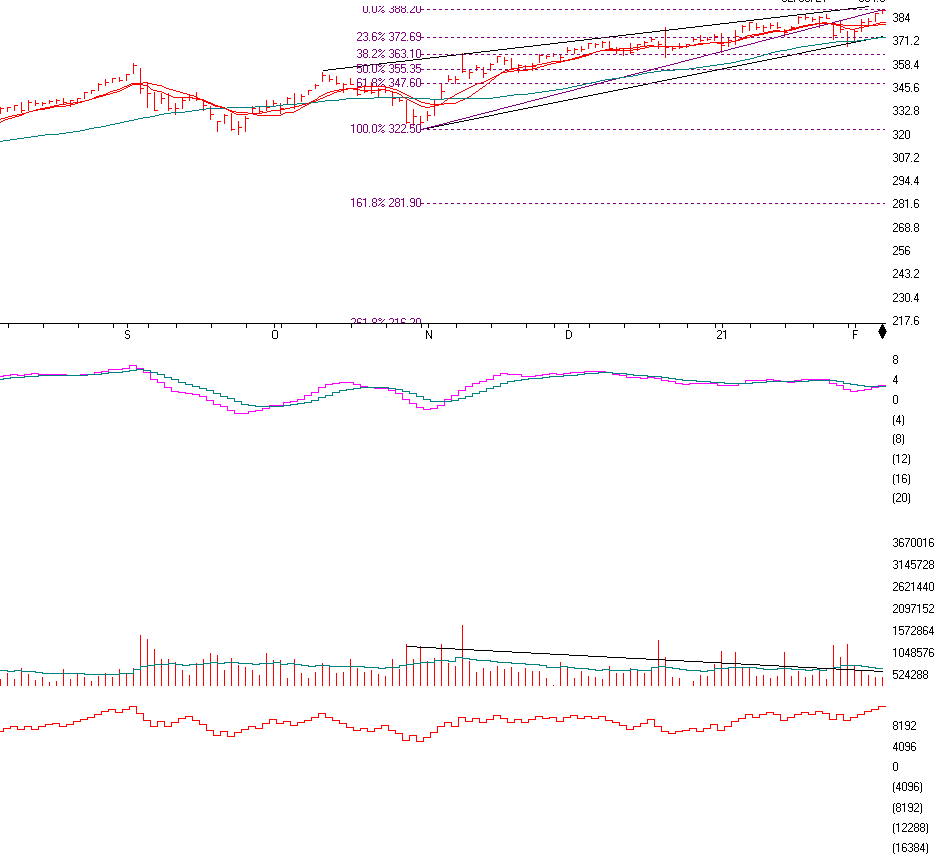
The S&P 500 is above. The S&P is now at a new high as it continues to go up in value. As the market continues to rise in anticipation of the economy rebounding it is perplexing many people on WHY it is rising so much. It is because earnings are coming in better than expected. Also, the market anticipates 6-9 months AHEAD of time. They think that by September the economy should be on its way to recovery. There is pattern above that I have mentioned before, and it is called A RISING WEDGE PATTERN.
A RISING WEDGE PATTERN is a Negative or a Bearish pattern. It rises up ward and goes to an APEX. This pattern rises on low volume and eventually breaks on the upside if it fails or the DOWNSIDE if it is a true Rising Wedge. This pattern now has to be watched and possibly act upon it if 371.2 on the SPY (S&P 500) tracking stock or 372.6 which is the 23.6% Fibonaccis level on the S&P. On the TRUE S&P 500 it’s 3744. So one is the SPY and one is the S&P. This is strange, the 50 day Moving average, the S&P Trend Line and the 23.6% Fibonacci Level is between 371 to 373 on the SPY or 3742 to 3744 on the S&P 500.This is extremely important to watch at this time as if they break and close below all 3 support levels, it could cause traders to SELL. I will be looking at these levels very keenly and will become VERY CAUTIOUS if they BREAK and CLOSE below those levels.
Momentum is the next chart and it shows that the market is getting a little tired.
Volume is the next indicator, and although volume is still relatively good, it is slowly declining on up days.
On-balance Volume is relatively good. So I will be watching these 3 major support levels to determine if the Market is in a SHORT TERM TOPPING ZONE. Call me to review your accounts.
Support levels on the S&P 500 area are 3743 to 3745 AREA, 3630, 3554, 3476 and 3225.
NASDAQ Support, 13758, 13567, 13171 (EXTREMELY IMPORTANT), 12721, 12358, and 12109.
Dow Jones 30681, 29559, 29215, 28018, 28482, and 27100
These may be safer areas to get into the equity markets on support levels slowly on the accumulation areas.
THE BOTTOM LINE:
The market has continued nicely over the last month mainly because of earnings of companies beating expectations and a recognition that the economy will eventually return to a growth pattern. The market looks to continue to grow and as the economy comes out of its recession, the small and midcap stocks as well as the large stocks could continue upward, BUT, the markets are forming a BEARISH RISING WEDGE and if 3743-3745 is broken and the S&P closes below the trend-line over the next few days or 2 weeks, I will get VERY CAUTIOUS. The Small Stocks have performed the best this year but starting to get a little tired. I am bullish over the long term but realize the markets have come so far, so fast. It may be time to reallocate money from stocks to a fixed account or other allocations to a more normalized allocation. Diversification is now important as the first 8 months of the recovery has been all large growth.
Joe Bartosiewicz, CFP®
Investment Advisor Representative
92 High Street
Thomaston, CT 06787
Securities and advisory services offered through SagePoint Financial, Inc. (SPF), member FINRA/SIPC. SPF is separately owned and other entities and/or marketing names, products or services referenced here are independent of SPF. 800-552-3319 20 East Thomas Road Ste 2000 Phoenix AZ 85012
Disclaimer: The views expressed are not necessarily the view of Sage Point Financial, Inc. and should not be interpreted directly or indirectly as an offer to buy or sell any securities mentioned herein. Securities and Advisory services offered through Sage Point Financial Inc., Member FINRA/SIPC, an SEC-registered investment advisor.
Past performance cannot guarantee future results. Investing involves risk, including the potential loss of principal. No investment strategy can guarantee a profit or protect against loss in periods of declining values. Please note that individual situations can vary. Therefore, the information presented in this letter should only be relied upon when coordinated with individual professional advice. *There is no guarantee that a diversified portfolio will outperform a non-diversified portfolio in any given market environment. No investment strategy, such as asset allocation, can guarantee a profit or protect against loss in periods of declining values.
It is our goal to help investors by identifying changing market conditions. However, investors should be aware that no investment advisor can accurately predict all of the changes that may occur in the market.
The price of commodities is subject to substantial price fluctuations of short periods and may be affected by unpredictable international monetary and political policies. The market for commodities is widely unregulated, and concentrated investing may lead to Sector investing may involve a greater degree of risk than investments with broader diversification.
Indexes cannot be invested indirectly, are unmanaged, and do not incur management fees, costs, and expenses.
Dow Jones Industrial Average: A weighted price average of 30 significant stocks traded on the New York Stock Exchange and the NASDAQ.
S&P 500: The S&P 500 is an unmanaged indexed comprised of 500 widely held securities considered to be representative of the stock market in general.
NASDAQ: the NASDAQ Composite Index is an unmanaged, market-weighted index of all over the counter common stocks traded on the National Association of Securities Dealers Automated Quotation System (IWM) I Shares Russell 2000 ETF: Which tracks the Russell 2000 index: which measures the performance of the small capitalization sector of the U.S. equity market.
A Moderate Mutual Fund risk mutual has approximately 50-70% of its portfolio in different equities, from growth, income stocks, international and emerging markets stocks to 30-50% of its portfolio in different categories of bonds and cash. It seeks capital appreciation with a low to moderate level of current income.
The Merrill Lynch High Yield Master Index: A broad-based measure of the performance of non-investment grade US Bonds MSCI EAFE: the MSCI EAFE Index (Morgan Stanley Capital International Europe, Australia, and Far East Index) is a widely recognized benchmark of non-US markets. It is an unmanaged index composed of a sample of companies’ representative of the market structure of 20 European and Pacific Basin countries and includes reinvestment of all dividends.
Investment grade bond index: The S&P 500 Investment-grade corporate bond index, a sub-index of the S&P 500 Bond Index, seeks to measure the performance of the US corporate debt issued by constituents in the S&P 500 with an investment-grade rating. The S&P 500 Bond index is designed to be a corporate-bond counterpart to the S&P 500, which is widely regarded as the best single gauge of large-cap US equities.
Floating Rate Bond Index is a rule-based, market-value weighted index engineered to measure the performance and characteristics of floating-rate coupon U.S. Treasuries, which have a maturity greater than 12 months.