May 8, 2021
Hello Everyone,
Over the last month the stock markets continue to rise. The Value sector, consisting of energy, financial, metals manufacturing and more are leading the way higher. These are the stocks that benefit from people and the companies in the economy that are benefiting from the recovery. Technology on the other hand continues to languish somewhat as they do not benefit as much as when people were confined to their homes using technology. On my Bartometer in December I thought the S&P 500 would reach 4200 to 4400 this year and the S&P is now nicely over 4200. Short term the markets are still relatively Bullish, but it is now 26% over valued. I feel that there is dramatic inflationary pressure in the economy as Copper, lumber, energy, wages and commodities in general are rising. This will put upward pressure on inflation but because the Federal Reserve will be somewhat restrained in raising interest rates because they cannot afford to pay higher rates to service the debt themselves. If, however, inflationary pressures continue to manifest themselves month after month then the Federal Reserve will have no choice but to raise interest rates sometime over the next year.
My Computer models are still on longer term Buy-Hold in the market and there are some worries, but the market technicals are still relatively ok, Albeit very overbought. This means to enjoy the ride, but we need to keep our hand on the exit door anytime I get long Term SELL signals. The NASDAQ is weak compared to the overall market.
As you know house prices are soaring and could continue for a little while longer as copper prices, lumber prices skyrocket. But if interest rates start to rise and the economy slows then houses prices should level off or even decline slightly, but house prices are still projected to go higher over the next year. If the stock market sells off from here, you may want to add more to your stock portfolio, if you have a longer-term horizon.
I still like the growth sector longer term, but the sector that should outperform going forward and as the economy rebounds, should be VALUE stocks.
Some of the INDEXES of the markets both equities and interest rates are below. The source is Morningstar.com up until May 07, 2021. These are passive indexes. YTD
Dow Jones +14.3%
S&P 500 +13.2%
EQUAL WEIGHTED S&P 500 +19.2%
NASDAQ Aggressive growth +6.6%
Large Cap Value +13.1%
I Shares Russell 2000 ETF (IWM) Small cap +15.1%
Midcap stock funds +18.1%
International Index (MSCI – EAFE ex USA +13.7%
International Emerging Markets +5.6%
Financial stocks +28%
Energy stocks +43%
Healthcare Stocks +9.0%
Moderate Mutual Fund Investment Grade Bonds (AAA) Long duration -3.86%
High Yield Merrill Lynch High Yield Index +2.3%
Floating Rate Bond Funds +2.01%
Short Term Bond +.2%
Multi sector bond funds +1.7%
Gold -3.8%
10 year Bond Yield 1.60%
Classicalprinciples.com and Robert Genetskis Excerpts
Market Outlook
Stocks were mixed this past week. The Dow was up 1½% to a new all-time high. Other key indexes were flat to down. The S&P500 was unchanged while the Nasdaq and QQQs fell 2%- 3%. Amid signs of an economic boom, foreign Central Bank heads are talking about tapering monetary stimulus. Some Fed officials have also referred to a need for adjusting policy. The Fed is lagging the rest of the world in recognizing the likely damage from current policy.
Expect more hints from the Fed about the slowing its purchases of securities. Stocks will continue to take hits whenever there are signs of a change in Fed policy. Stocks will take another hit when the Fed begins to raise interest rates. These hits to the market are likely to be temporary setbacks. The real hit to stocks will come when the Fed makes a move to significantly slow the growth in the money supply. It’s likely we are still a long way from that move. Although the S&P500 remains 26% above its fundamental value, the Fed’s ongoing purchases of securities should keep stock prices elevated. For now, stay bullish and enjoy the ride. The recent drop in longer-term interest rates is a temporary development. If you are considering borrowing money, do it now. As inflationary pressures continue to build, look for interest rates to head higher.
A Look Back
The economy soared going into the first quarter with current dollar spending (GDP) up at an 11% annual rate. Recent data indicate business continues to increase rapidly this quarter. Today’s job report shows private payroll jobs increased by 218,000 in April. This was well below expectations. The latest numbers show employment levels remain about 5% below its prior peak. Government payments have encouraged people not to work. This keeps employment down and adds to a shortage of workers.
Stock Valuation: S&P 500 26% Overvalued
Economic Fundamentals: Positive
Monetary Policy; Highly Expansive
.
Source: Classical Principles.com
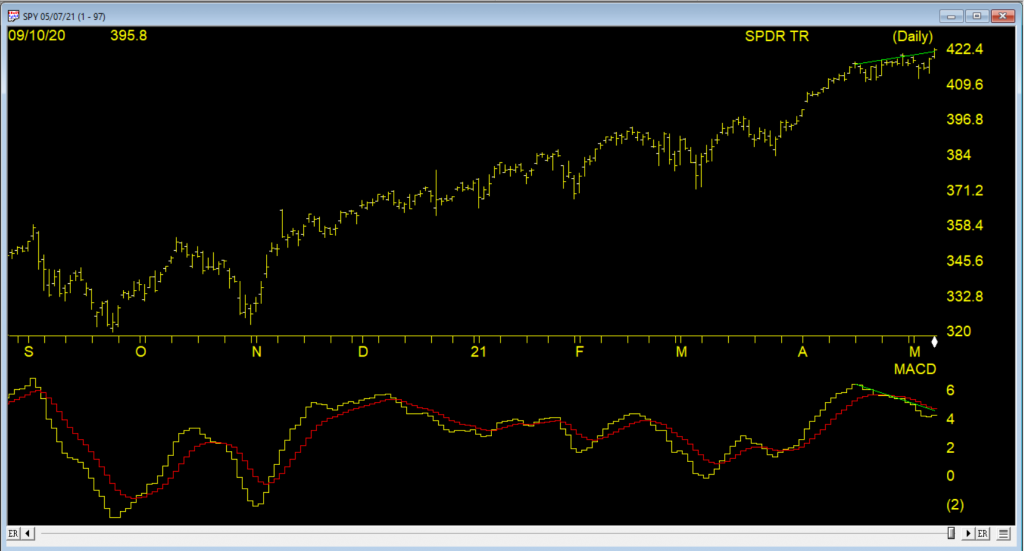
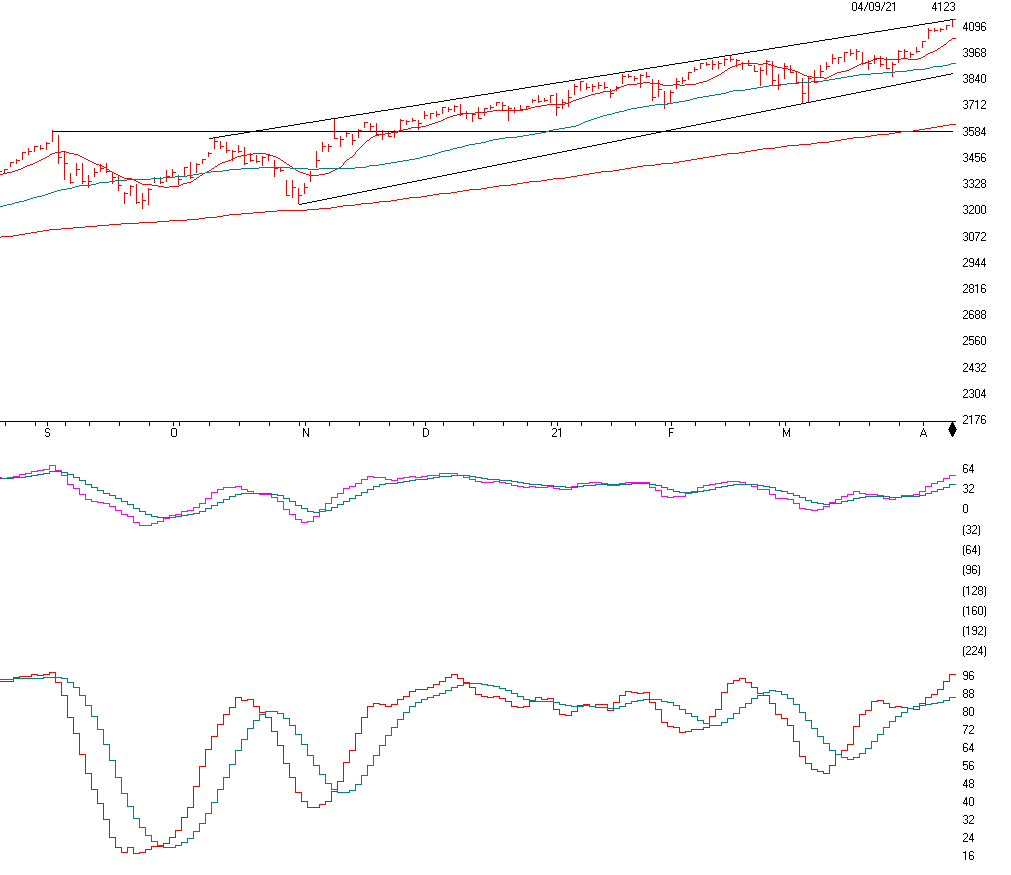
Above is the S&P 500 and the tracking stock with the symbol the SPY. It is currently up 13.27% for the year. Notice the resistance level of 422.12. If the SPY closes below 411, I will get Cautious, but a drop below 410 and I would get even more Cautious. But if on Monday the Spy closes above 422.5, then we continue to look for higher highs!
402 on the S&P is major support and I wouldn’t want it to close below that level. Any close below 402 would make me Very Cautious.
Over all, I am still relatively Bullish, but I need to be concerned that this market is going up too fast and should revert to the mean.
Momentum is still relatively good, but if it closes below the 410 level on the SPY, it will get me to reduce equities somewhat.
Support levels on the S&P 500 area are 4110, 4100, 4020, 3650.
▪ These may be safer areas to get into the equity markets on support levels slowly on the accumulation areas.
THE BOTTOM LINE:
I am still relatively Bullish on the market, but my total target of 4400 on the S&P 500 is quickly approaching. The Value sector of the market and mid and large value still look good over the short term, but over the longer-term technology which is only up about 6% should perform the best. Keep a disciplined approach to investing and don’t chase the performers, you may get hurt. I like inflationary protection investments for a percentage of money.
Best to all of you,
Joe Bartosiewicz, CFP®
Investment Advisor Representative
Contact information:
860-940-7020.
Joe Bartosiewicz, CFP®
92 High Street
Thomaston, CT 06787 and
7501 East MCDowell RD 2172
Scottsdale, AZ 85257
Securities and advisory services offered through SagePoint Financial, Inc. (SPF), member FINRA/SIPC. SPF is separately owned and other entities and/or marketing names, products or services referenced here are independent of SPF. 800-552-3319 20 East Thomas Road Ste 2000 Phoenix AZ 85012
Disclaimer: The views expressed are not necessarily the view of Sage Point Financial, Inc. and should not be interpreted directly or indirectly as an offer to buy or sell any securities mentioned herein. Securities and Advisory services offered through Sage Point Financial Inc., Member FINRA/SIPC, an SEC-registered investment advisor.
Past performance cannot guarantee future results. Investing involves risk, including the potential loss of principal. No investment strategy can guarantee a profit or protect against loss in periods of declining values. Please note that individual situations can vary. Therefore, the information presented in this letter should only be relied upon when coordinated with individual professional advice. *There is no guarantee that a diversified portfolio will outperform a non-diversified portfolio in any given market environment. No investment strategy, such as asset allocation, can guarantee a profit or protect against loss in periods of declining values.
It is our goal to help investors by identifying changing market conditions. However, investors should be aware that no investment advisor can accurately predict all of the changes that may occur in the market.
The price of commodities is subject to substantial price fluctuations of short periods and may be affected by unpredictable international monetary and political policies. The market for commodities is widely unregulated, and concentrated investing may lead to Sector investing may involve a greater degree of risk than investments with broader diversification.
Indexes cannot be invested indirectly, are unmanaged, and do not incur management fees, costs, and expenses.
Dow Jones Industrial Average: A weighted price average of 30 significant stocks traded on the New York Stock Exchange and the NASDAQ.
S&P 500: The S&P 500 is an unmanaged indexed comprised of 500 widely held securities considered to be representative of the stock market in general.
NASDAQ: the NASDAQ Composite Index is an unmanaged, market-weighted index of all over the counter common stocks traded on the National Association of Securities Dealers Automated Quotation System
(IWM) I Shares Russell 2000 ETF: Which tracks the Russell 2000 index: which measures the performance of the small capitalization sector of the U.S. equity market.
A Moderate Mutual Fund risk mutual has approximately 50-70% of its portfolio in different equities, from growth, income stocks, international and emerging markets stocks to 30-50% of its portfolio in different categories of bonds and cash. It seeks capital appreciation with a low to moderate level of current income.
The Merrill Lynch High Yield Master Index: A broad-based measure of the performance of non-investment grade US Bonds
MSCI EAFE: the MSCI EAFE Index (Morgan Stanley Capital International Europe, Australia, and Far East Index) is a widely recognized benchmark of non-US markets. It is an unmanaged index composed of a sample of companies’ representative of the market structure of 20 European and Pacific Basin countries and includes reinvestment of all dividends.
Investment grade bond index: The S&P 500 Investment-grade corporate bond index, a sub-index of the S&P 500 Bond Index, seeks to measure the performance of the US corporate debt issued by constituents in the S&P 500 with an investment-grade rating. The S&P 500 Bond index is designed to be a corporate-bond counterpart to the S&P 500, which is widely regarded as the best single gauge of large-cap US equities.
Floating Rate Bond Index is a rule-based, market-value weighted index engineered to measure the performance and characteristics of floating-rate coupon U.S. Treasuries, which have a maturity greater than 12 months.