AIQ code based on Dion Kurczek’s article in March 2026 Stocks & Commodities, “One Percent A Week: A High-Probability Weekly Trading Strategy For TQQQ,” for trading TQQQ is provided in the code file below.
Here’s a look at developing a mean-reversion trading strategy with a minimal number of rules, low time commitment, and a consistent weekly profit target. It could be used by systematic traders and discretionary traders alike. Each rule exists to serve one overarching purpose: capture a 1% gain on TQQQ once per week, on average, without excessive drawdowns or overtrading.
Note that the code provided does not implement the breakeven exit, so once a trade is entered, it is held until it hits the profit target or Friday’s close if the profit target is never hit.
! One Percent A Week (TQQQ)
! Author: Dion KUrczek, TASC March 2026
! Coded by Richard Denning, 1/16/26

!*********BREAK EVEN EXIT NOT IMPLEMENTED*********

! Abbreviations:
O is [open].
L is [low].
H is [high].
C is [close].
OSD is offsettodate(month(),day(),year()).

! Return values for DayOfWeek() function:
Mon if DayOfWeek()  = 0.
Tues if DayOfWeek()  = 1.
Wed if DayOfWeek()  = 2.
Thur if DayOfWeek()  = 3.
Fri if DayOfWeek()  = 4.

! Get the open on Monday:
Mon_os is scanany( DayOfWeek()  = 0, 5) then OSD.
O_Mon is valresult(O,^Mon_os).

! Get the close on Friday:
Fri_os is scanany( DayOfWeek()   = 4, 5) then OSD.
C_Fri is valresult(C, ^Fri_os).

! Limit and profit targets:
LimEnt is O_Mon * 0.99.    ! Enter at Limit
PT is LimEnt * 1.01.           ! Exit at profit target

ExitPrice is iff(Mon and H>=PT,PT,
	iff(Tues and H>=PT,PT,
	iff(Wed and H>=PT,PT,
	iff(Thur and H>=PT,PT,
	iff(Fri and H>=PT,PT,^C_Fri))))).

CountEntries is countof(L <= LimEnt, DayOfWeek() + 1).
CountExits is countof(H >= PT, DayOfWeek()  + 1).

 ! Limit trades to one per week:
Buy if L <= LimEnt and CountEntries = 1 and CountExits <= 1.

!Exit at profit target or Friday's close:
Sell if H >= PT or DayOfWeek()=4.

ShowValues if 1.
If you’ve been trading for any length of time, you’ve probably noticed something frustrating.
You understand what indicators are. You know what MACD stands for. You can draw Bollinger Bands on a chart.
But somehow, you’re still not getting the results you want.
Here’s why: There’s a massive difference between knowing about technical indicators and actually using them to make profitable trading decisions.
Most trading education focuses on one or the other. Either you get theoretical knowledge with no practical application, or you get specific strategies with no understanding of why they work.
Today, I want to show you why you need both – and how to get them.
The Foundation: Understanding Technical Indicators
Let’s start with a simple question: Do you really understand what MACD is measuring?
Not just the textbook definition. I mean, do you understand what the convergence and divergence of moving averages tells you about market momentum?
Most traders don’t.
They know MACD exists. They know there’s a signal line and a histogram. They might even know the standard 12, 26, 9 settings.
But they don’t understand what’s actually happening beneath the surface.
This is why foundation matters.
The 29 Essential Indicators Every Trader Should Know
Professional traders don’t just use one or two indicators. They have a complete toolkit they can draw from depending on market conditions.
Here are just some of the critical indicators you should master:
Trend Indicators:
Moving Averages (Simple and Exponential)
MACD (Moving Average Convergence Divergence)
ADX (Average Directional Index)
Parabolic SAR
Momentum Indicators:
RSI (Relative Strength Index)
Stochastics
Commodity Channel Index
Velocity
Volume Indicators:
Volume bars
Volume Oscillator
Accumulation/Distribution
Volume Accumulation Percentage
Volatility Indicators:
Bollinger Bands
Trading Bands
Volatility Index
Pattern Recognition Tools:
ZigZag
21-Day High/Low
Advance/Decline Indicators
Each of these indicators serves a specific purpose. Each works best in specific market conditions. And most importantly, each becomes exponentially more powerful when combined with others.
Why Optimal Settings Matter
Here’s something most traders get wrong: They think indicator settings are arbitrary.
They’re not.
Gerald Appel didn’t choose 12, 26, and 9 for MACD randomly. These numbers correspond to trading weeks – 12 periods is roughly two and a half weeks, 26 is about one month, and 9 represents approximately two weeks.
This alignment with natural trading cycles is why these settings work so well across different markets and timeframes.
Understanding the “why” behind optimal settings helps you make better decisions about when to adjust them (and when not to).
The Execution: Mastering High-Probability Patterns
Now, let’s say you understand all the indicators. You know what they measure, when to use them, and how to optimize their settings.
You’re still missing something critical: Pattern recognition.
This is where most traders fail. They understand the tools but don’t know how to identify the highest-probability setups.
The Power of MACD Divergence
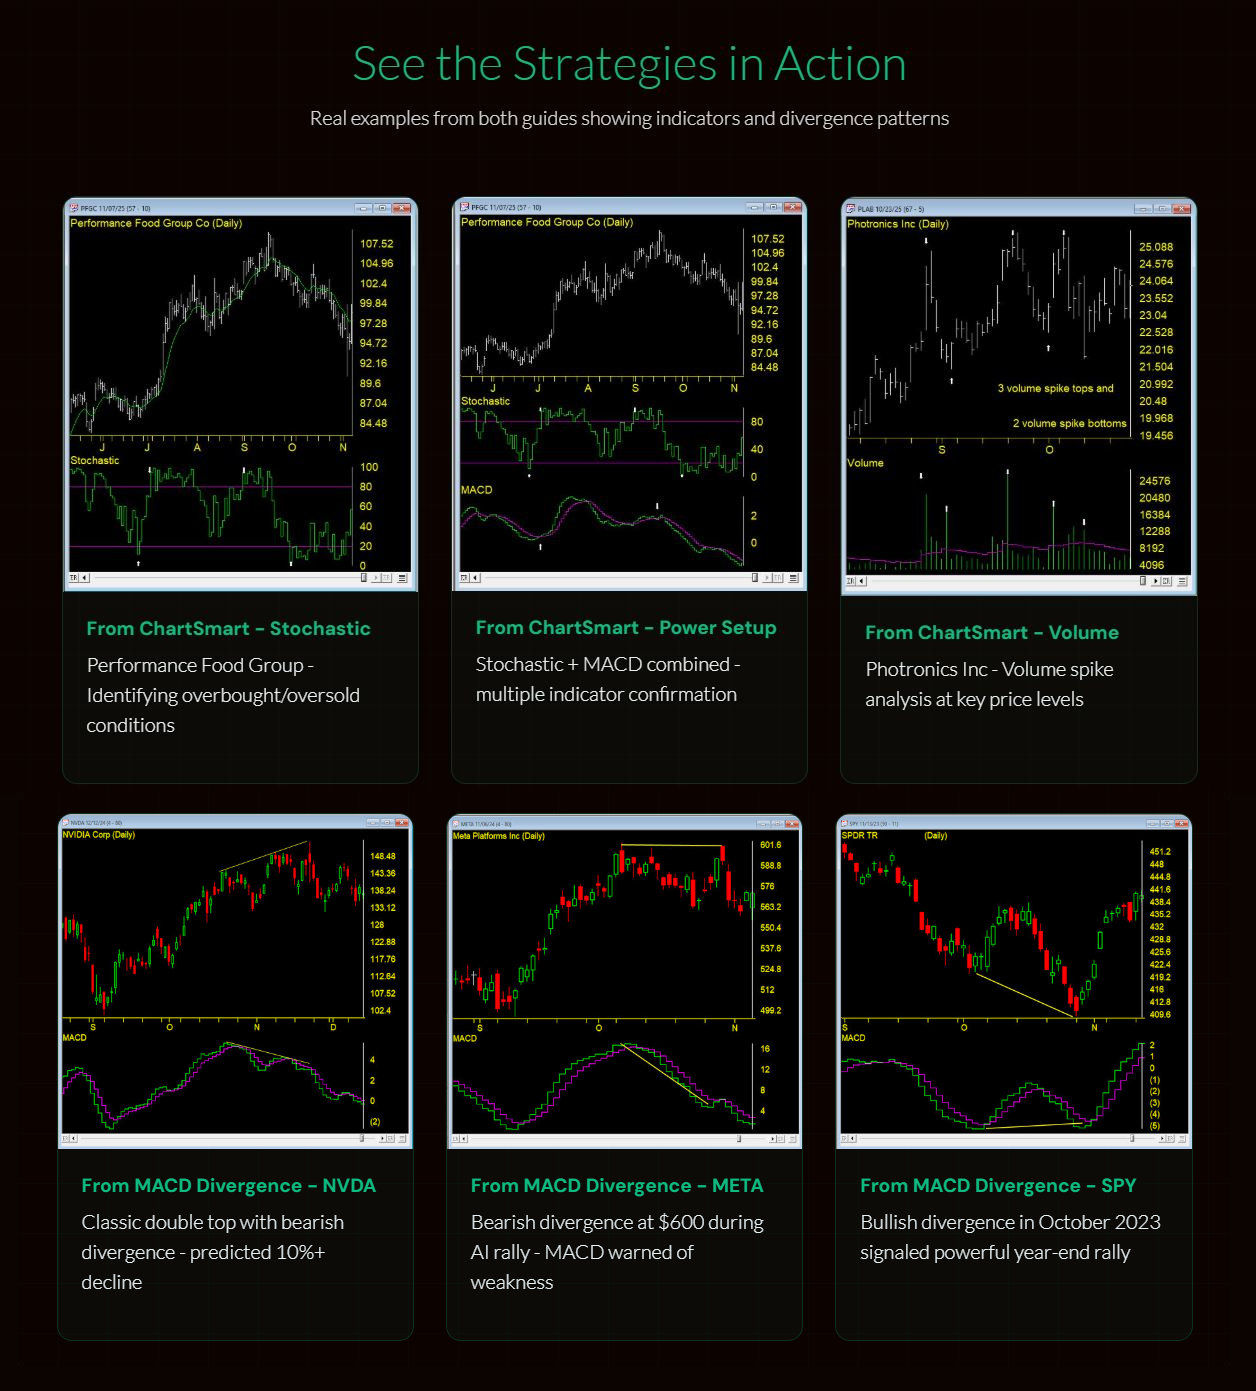
Let me give you a real example.
In November 2024, NVIDIA was trading around $140-150. Most traders were bullish. The momentum looked strong. The stock was making new highs.
But there was a problem.
While price was making higher highs, MACD was making lower highs. This is called bearish divergence – and it’s one of the most powerful reversal signals in technical analysis.
Traders who recognized this pattern could have anticipated the 10%+ pullback that followed.
This is the power of pattern recognition.
The Four Types of Divergence
There are actually four types of divergence patterns every trader should master:
1. Regular Bullish Divergence
Price makes lower low, MACD makes higher low
Signals potential reversal from downtrend to uptrend
Best at significant support levels
2. Regular Bearish Divergence
Price makes higher high, MACD makes lower high
Signals potential reversal from uptrend to downtrend
Best at resistance levels (like the NVIDIA example)
3. Hidden Bullish Divergence
Price makes higher low, MACD makes lower low
Signals trend continuation in uptrends
Great for adding to positions during pullbacks
4. Hidden Bearish Divergence
Price makes lower high, MACD makes higher high
Signals trend continuation in downtrends
Used for entering short positions during bounces
Real Examples from Major Stocks
Let me show you some recent examples:
Meta Platforms (META) – October 2024 During the AI-driven rally, META pushed to $600. Most traders were chasing the momentum. But MACD showed clear bearish divergence, warning that the rally was losing steam. The subsequent correction proved the pattern right.
S&P 500 (SPY) – October 2023 The market made a lower low in late October 2023, causing fear among traders. But MACD showed bullish divergence, suggesting selling pressure was exhausted. This pattern preceded the powerful year-end rally.
Apple (AAPL) – April 2023 During an uptrend, AAPL pulled back, making a higher low. MACD made a lower low – hidden bullish divergence. This continuation pattern signaled that the uptrend was intact, providing an excellent entry point.
These aren’t cherry-picked examples. These are patterns that appeared on major stocks, providing actionable trading opportunities for those who knew how to recognize them.
Why You Need Both Foundation and Execution
Here’s the key insight: Foundation without execution is just theory. Execution without foundation is just guessing.
You need both.
The Foundation (Indicator Knowledge) Gives You:
Understanding of what’s happening in the market
Knowledge of which tools to use when
Ability to optimize settings for your timeframe
Framework for combining indicators
Confidence in your analysis
The Execution (Pattern Recognition) Gives You:
Specific entry and exit signals
High-probability setup identification
Risk management framework
Real-world application
Actionable trading strategies
Together, they create complete technical analysis mastery.
How to Get Started
If you’re serious about improving your trading, you need both pieces of the puzzle.
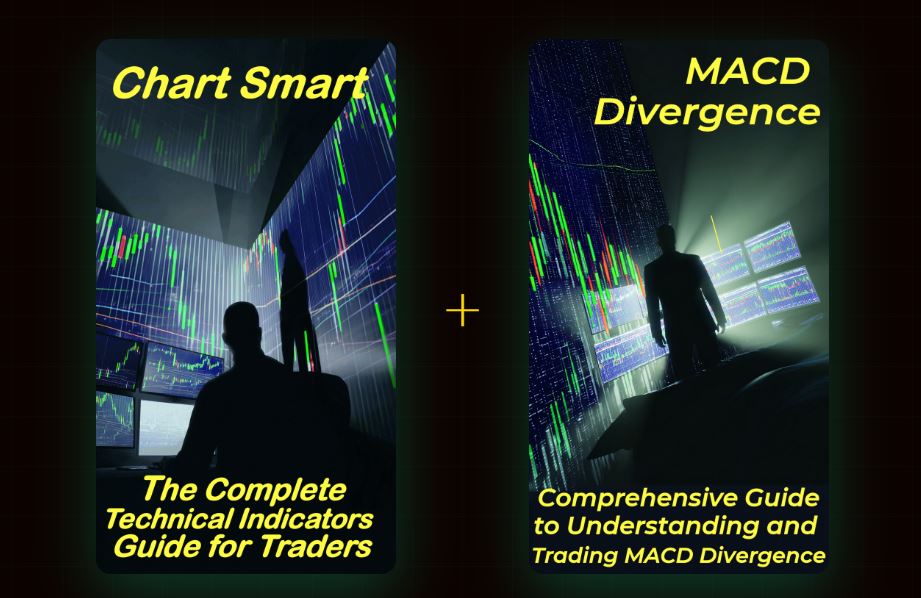
That’s why I’ve created the Technical Analysis Mastery Bundle – combining two comprehensive guides that give you both the foundation and the execution:
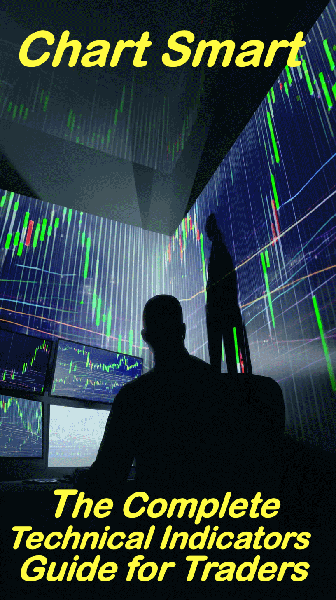
ChartSmart: The Complete Technical Indicators Guide
All 29 essential indicators explained in plain English
Real examples from NVDA, META, SPY, AAPL, MSFT, AMZN
Double top and double bottom pattern trading
Complete entry, stop loss, and profit target framework
Risk and money management systems
Platform-ready setup instructions
The Investment
Individually, these guides cost $59 and $59 respectively – $118 total.
But when you get them together as a bundle, you pay just $88.
That’s $30 in savings, and more importantly, you get the complete toolkit you need to master technical analysis from foundation to execution.
What You Get Immediately
When you order the Technical Analysis Mastery Bundle, here’s what happens:
Instant access to both comprehensive PDF guides
100+ pages of actionable trading knowledge
40+ real chart examples showing exactly how patterns work
Platform setup instructions so you can implement immediately
Lifetime access with no recurring fees
This isn’t a course that drips content over weeks. You get everything immediately and can start learning today.
Real Results You Can Expect
Let me be clear about something: These guides won’t make you rich overnight. No trading education can promise that.
But here’s what they will do:
Short-term (First Month):
Better understanding of what indicators actually measure
Ability to identify divergence patterns on your own charts
More confidence in your analysis
Fewer conflicting signals causing confusion
Medium-term (3-6 Months):
Consistently identifying high-probability setups
Better entry and exit timing
Improved risk management
Growing pattern recognition skills
Long-term (6+ Months):
Complete technical analysis mastery
Professional-level chart reading
Ability to combine multiple indicators effectively
Track record of well-timed entries and exits
The guides give you the knowledge and frameworks. Your practice and application turn that into trading results.
Who This Bundle Is For
This bundle is perfect if you:
Want to build a solid foundation in technical analysis
Are tired of conflicting signals and confusing indicators
Want to identify high-probability setups like professionals do
Need practical strategies you can implement immediately
Trade stocks, ETFs, forex, crypto, or other markets
Are committed to improving your trading skills
This bundle is NOT for:
People looking for “get rich quick” schemes
Traders who want someone else to give them signals
Those unwilling to invest time in learning
Anyone expecting guaranteed profits from education alone
The Bottom Line
Technical analysis mastery requires two things: solid foundation and practical execution.
Most traders only get one or the other. That’s why most traders struggle.
This bundle gives you both.
The complete indicator toolkit. The pattern recognition skills. The trading frameworks. The real examples. Everything you need to analyze charts like a professional.
Usually $118 if purchased separately. Just $88 as a bundle.
Q: Do I need prior trading experience? A: Basic trading knowledge is helpful, but the guides explain everything in plain English. If you know what a stock chart is and have traded before, you’re ready for this content.
Q: What markets do these strategies work in? A: Technical analysis works across all liquid markets – stocks, ETFs, forex, crypto, commodities. The principles are universal.
Q: Can I get a refund if I don’t like it? A: Due to the digital nature of the products, all sales are final. However, the guides include 100+ pages of content with 40+ real examples, so you can see exactly what you’re getting before you buy.
Q: How long do I have access? A: Lifetime. One payment, permanent access. No recurring fees or subscriptions.
Q: Will this work on my trading platform? A: Yes. The guides include general instructions that work across most major platforms (TradingView, ThinkOrSwim, MetaTrader, AIQ, etc.). The indicators covered are standard across all platforms.
Q: How long will it take to master this material? A: You can read through both guides in a few days. But real mastery comes from applying the concepts to live charts over weeks and months. Most traders see significant improvement within 1-3 months of consistent practice.
Q: Is this a course with videos? A: No, these are comprehensive PDF guides with extensive chart examples. You read through the material at your own pace and apply the concepts to your own trading.
Your Next Step
The gap between knowing about indicators and using them profitably is what separates struggling traders from successful ones.
This bundle bridges that gap.
The foundation. The execution. The complete toolkit.
For less than the cost of a single bad trade, you get everything you need to master technical analysis from theory to practice.
How Five Market Timing Signals Captured 4,500 Points While Avoiding Two Major Declines
One of the most common questions we hear from traders is: “Can a systematic approach really identify market turning points in real-time?” The answer is yes—when you have the right tools and a disciplined, rule-based methodology.
Let me show you exactly how AIQ Market Timing navigated a volatile 2.5-month period from October 2025 through January 2026, capturing three significant rallies totaling 4,500 points while protecting capital during two major reversals totaling over 3,000 points of decline.
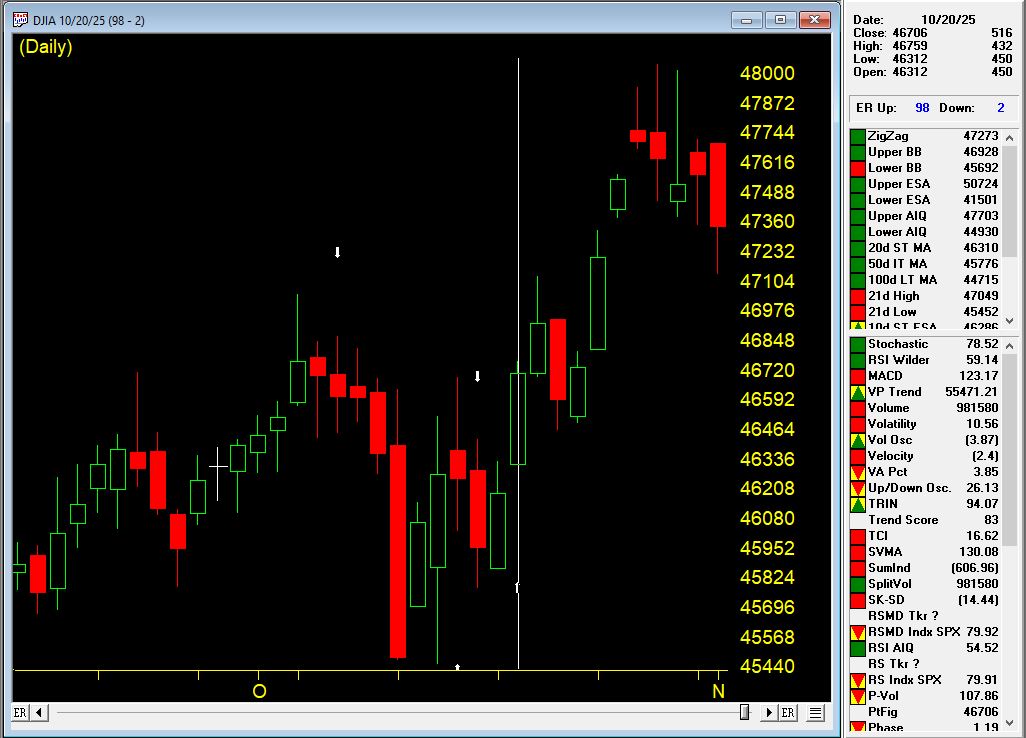
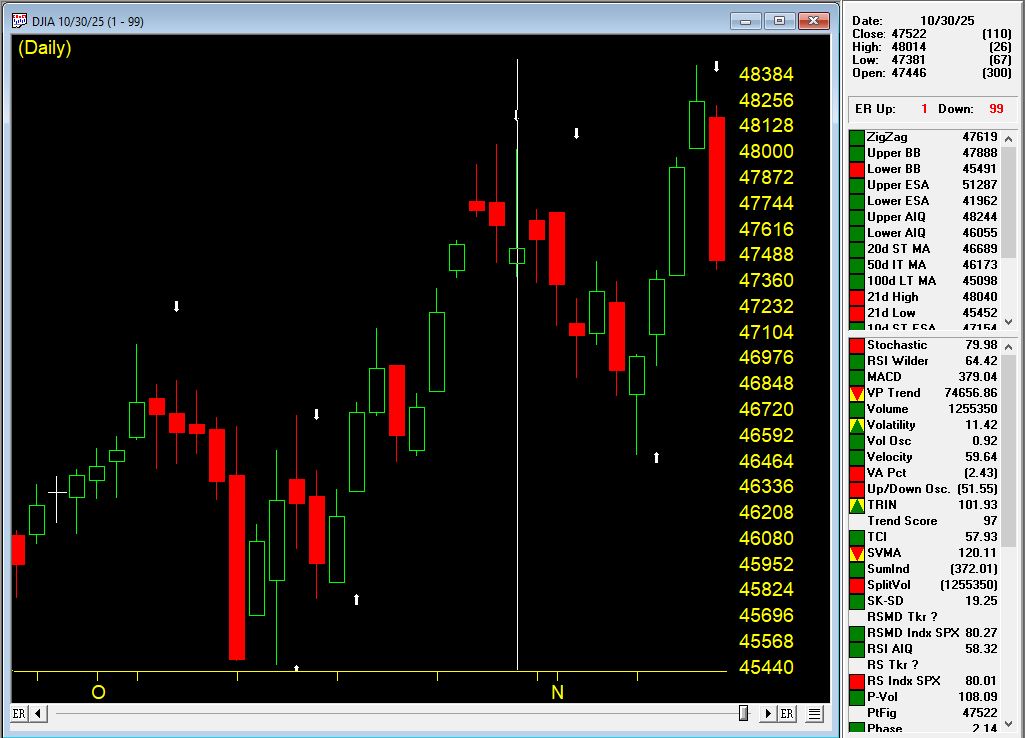
The Setup: Multiple Bullish Confirmations (October 20, 2025)
On October 20th, AIQ Market Timing issued a 98 UP signal at 46,707 on the Dow Jones Industrial Average. But this wasn’t just a single indicator flashing green—it was a confluence of five critical rules firing simultaneously:
Rule #1: Trend Status Confirmation
Trend Status changed to a weak upward trend
This indicated an upward trend was starting that could continue
Classification: Moderate bullish signal
Rule #2: Exponentially Smoothed A/D Line
The smoothed advance/decline line turned positive
Key factor: The UD volume oscillator and A/D oscillator were ALREADY positive
This alignment is viewed as bullish, often preceding upward price movement
Rule #3: Up/Down Volume Oscillator
The UD volume oscillator turned positive
Confirmation: A/D oscillator and smoothed A/D line were already positive
This convergence signaled institutional buying was building
Rule #4: Advance/Decline Oscillator
The A/D oscillator turned positive
Supporting indicators: UD volume and smoothed A/D line already positive
Multiple breadth measures confirming the move
Rule #5: Volume Accumulation Alignment
A/D oscillator turned positive with volume accumulation already positive
In a weak upward market, this signals prices could continue rising
Professional money was accumulating positions
The Result: +1,333 Points in 8 Days
The market moved from 46,707 on October 21st to 48,040 on October 29th—a gain of 1,333 points (+2.85%) in just eight trading days.
This is the power of waiting for multiple confirming indicators rather than jumping on single signals. The system identified strong internal market momentum that wasn’t yet obvious to casual observers.
The Top: System Catches the Reversal (October 30, 2025)
Just one day after the market high, on October 30th at 47,659, AIQ Market Timing 98 issued a DOWN signal. The system caught the top within just 11 points of the absolute high (48,040 vs. 47,659).
Two Critical Bearish Rules Fired:
Rule #1: Breadth Deterioration
The exponentially smoothed A/D line turned negative
Warning sign: UD volume oscillator and A/D oscillator were already negative
This indicated institutional distribution was underway
Rule #2: Volume Accumulation Breakdown
Volume accumulation turned negative
The A/D oscillator was already negative
In a downtrending market, this bearish signal often precedes price declines
Initial Decline: -1,164 Points in 7 Days
From the October 31st level of 47,659, the market dropped to 46,495 by November 7th—a decline of 1,164 points (-2.44%) in seven trading days.
Traders following these signals would have been long for the +2.85% rally and either flat or profitably short for the -2.44% decline.
The Confirmation: Second Down Signal (November 4, 2025)
On November 4th, while the market was still declining, AIQ Market Timing 98 issued a second DOWN signal, reinforcing the bearish outlook. This is where systematic trading truly shines—when multiple signals confirm the trend in real-time.
Three Additional Bearish Rules Fired:
Rule #1: Trend Status Reversal
Trend Status changed to a weak downward trend
This confirmed the downward trend was likely to continue
Classification: Moderate bearish signal
Rule #2: Stochastic and Volume Divergence
Volume accumulation percentage was decreasing
The 21-day stochastic moved below the 80% line
In a downtrending market: Strong bearish signal
This combination often precedes significant downward price movement
Rule #3: UD Volume Oscillator Breakdown
The UD volume oscillator turned negative
Critical context: Smoothed A/D line and A/D oscillator were already negative
This confirmed selling pressure was intensifying
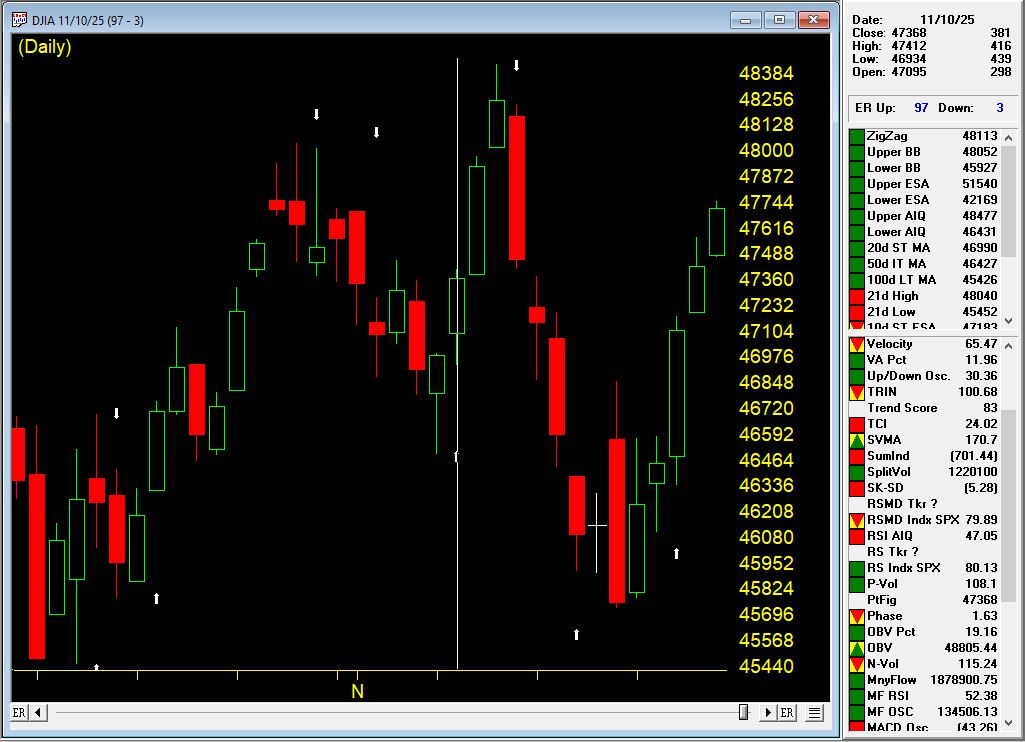
Signal #3: Back to Bullish (November 10, 2025)
On November 10th at 47,368, AIQ Market Timing issued an UP signal (97), indicating the correction had run its course and a new upward move was beginning.
Four Powerful Bullish Rules Fired:
Rule #1: Exponentially Smoothed A/D Line
Turned positive with UD volume oscillator and A/D oscillator already positive
This alignment indicated strong bullish internal momentum building
Rule #2: Advance/Decline Oscillator Confirmation
Turned positive with UD volume oscillator and smoothed A/D line already positive
Multiple breadth measures confirming the new uptrend
Rule #3: Volume Accumulation Alignment
A/D oscillator turned positive with volume accumulation already positive
In a sideways market, this signals prices could begin upward movement
Professional buying was returning
Rule #4: New High/New Low Reversal
The NH/NL indicator reversed to the upside
Classification: Reliable bullish signal
Often followed by upward price movement
In a sideways market, an uptrend could start shortly
The Rally: +1,063 Points in 3 Days
The market surged from 47,384 on November 11th to 48,431 on November 13th—a gain of 1,040 points (+2.22%) in just three trading days.
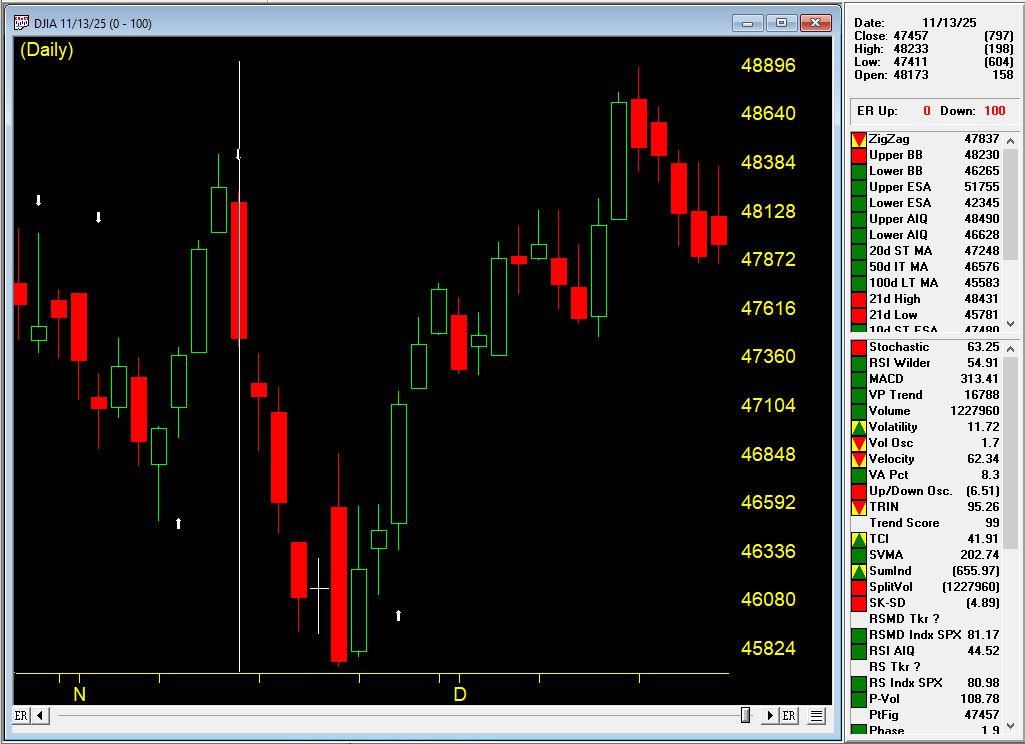
Signal #4: The Top Again (November 13, 2025)
At the market high of 48,233, AIQ Market Timing issued a DOWN signal (100), once again catching the reversal with precision.
Five Bearish Rules Fired:
Rule #1: Stochastic and Price Phase Weakness
21-day stochastic declined below the 80% line
Price phase indicator also decreasing
In the uptrending market: Weak bearish signal indicating possible near-term decline
Rule #2: Smoothed A/D Line Breakdown
Turned negative with UD volume and A/D oscillator already negative
Clear sign of breadth deterioration
Rule #3: UD Volume Oscillator Reversal
Turned negative with smoothed A/D line and A/D oscillator already negative
Institutional selling was intensifying
Rule #4: A/D Oscillator Breakdown
Turned negative with UD volume and smoothed A/D line already negative
All breadth measures aligned bearishly
Rule #5: New High/New Low Reversal
The NH/NL indicator reversed to the downside
Classification: Reliable bearish signal
Often followed by downward price movement
In an uptrending market, a trend reversal could occur
The Decline: -1,500 Points in 7 Days
From November 14th’s open of 47222, the market plunged to 45,728 on November 20th—a drop of nearly 1500 points (3.16%) in five trading days.
This was a significant correction that caught many traders off guard. But AIQ Market Timing identified it precisely at the top.
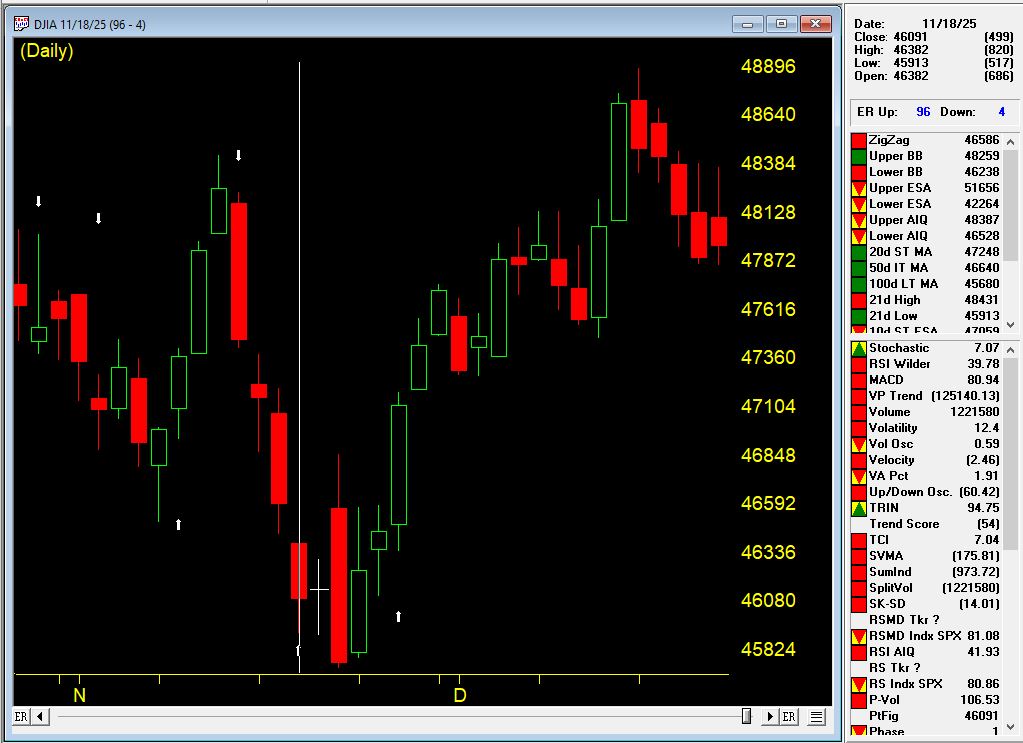
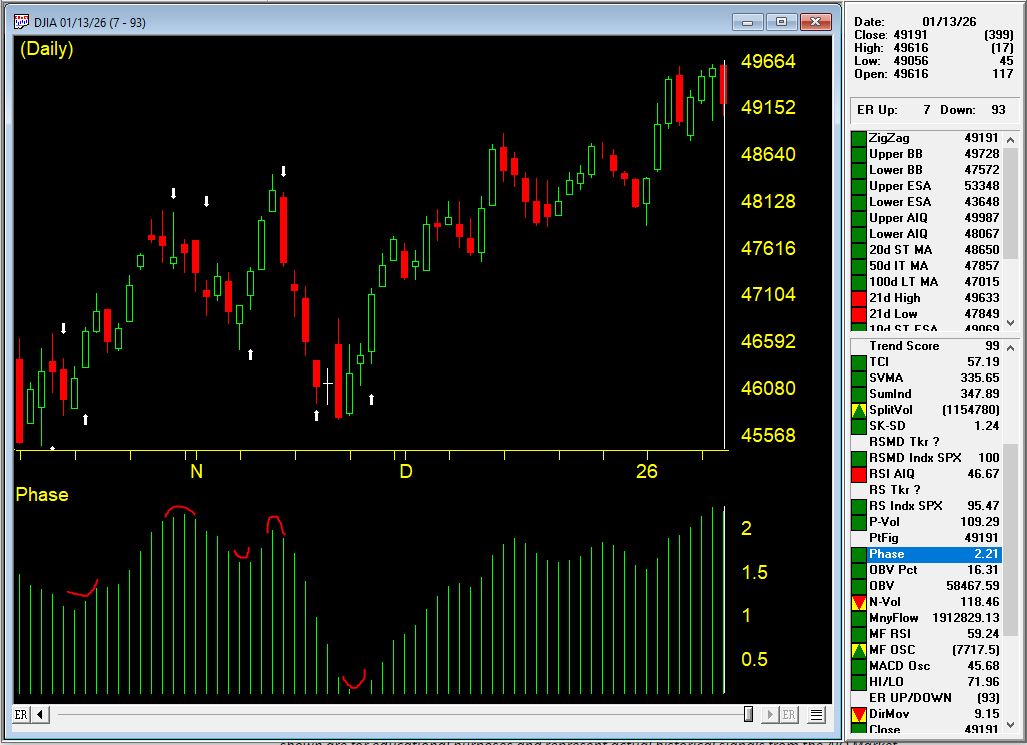
Signal #5: The Current Rally (November 18, 2025 – Present)
On November 18th at 46,091, AIQ Market Timing issued an UP signal (96), catching the bottom of the correction and positioning traders for what would become a powerful sustained rally.
The Rally Continues: over 3000 Points and Counting
From the November 19th entry at 46,138, the market has surged to 49,616 as of January 13, 2026—a gain of over 3,300 points (+7.0%) that is STILL RUNNING.
This ongoing rally has already lasted 45 days and shows the power of staying with a trend when the system confirms the move.
The Complete Picture: What This Teaches Us
Over a 2.5-month period from October 21, 2025 to January 9, 2026, AIQ Market Timing issued five signals:
The Numbers Are Staggering
Total gains captured: over 5,000 points across three rallies Total declines avoided: over 3,000 points across two corrections Current position: Still long in a rally that has gained 7.0%
Compare this to buy-and-hold over the same period:
Started: 46,707 (Oct 21)
Current: 49,504 (Jan 9)
Buy-and-hold gain: +2,797 points (+5.99%)
This sequence demonstrates several critical principles of successful systematic trading:
1. Confirmation Over Single Indicators
Every up signal had multiple rules firing together—not weak, isolated signals but powerful confluences showing aligned market internals. Signal #1 had five rules, Signal #3 had four rules including the reliable NH/NL indicator.
2. Speed Matters
The system caught reversals with remarkable precision: one day after the October high, right at the November 13th high. Manual observation would have missed these turning points.
3. Internal Strength vs. Price Action
The breadth indicators (A/D measures, volume accumulation, UD volume, NH/NL) detected shifts in market character before they became obvious in price alone.
4. Consistency Across Different Market Conditions
This wasn’t a lucky streak. The system worked in:
Weak upward trends (October)
Weak downward trends (early November)
Sideways markets (mid-November)
Strong sustained uptrends (late November – January)
5. Multiple Cycles Compound Returns
Notice how the system didn’t just catch ONE move—it navigated FIVE distinct market phases. This is where systematic trading truly shines: the ability to stay on the right side of the market through multiple cycles.
6. Reliable Indicators Add Conviction
The New High/New Low indicator appeared in both Signal #3 (bullish reversal) and Signal #4 (bearish reversal), classified as “reliable” both times. When these high-probability signals appear, they deserve attention. Adding in the Phase indicator, confirmation was present for all the signals and is considered a valid confirmation within +/- 3 days of the signal.
7. Both Sides of the Market
This wasn’t just about catching rallies. The system protected capital by identifying when conditions changed, allowing traders to exit longs, stay in cash, or even profit from declines totaling 3,669 points.
Multiply this advantage over weeks, months, and years, and you begin to understand why systematic, rule-based trading provides such a significant edge.
The Bottom Line
AIQ Market Timing isn’t about predictions or gut feelings. It’s about:
Objective rules that fire based on market internals
Multiple confirming indicators that reduce false signals
Real-time alerts that keep you informed as conditions change
Historical validation proving the methodology works across different market environments
Consistent performance across multiple market cycles
Are you ready to trade with this level of systematic precision? $1 trial available
Learn more about AIQ Market Timing 98 and other professional-grade technical analysis tools at AIQ Systems.
Past performance does not guarantee future results. All trading involves risk. The examples shown are for educational purposes and represent actual historical signals from the AIQ Market Timing system.
I dagens spelscenario har extern marknad för spel blivit allt mer populär, men med den ökade intresset följer också en rad potentiella problem. För många spelare kan de otydliga villkoren vara en stor källa till förvirring, vilket kan leda till missförstånd och oväntade konsekvenser. Många som väljer att registrera sig på dessa plattformar kan ställas inför registreringsproblem som försvårar deras spelupplevelse.
En av de största farorna med att spela på oreglerade plattformar är de skattemässiga aspekterna. Generellt sett kan vinster från utländska spelaktörer vara föremål för skatter, vilket många spelare kanske inte är medvetna om. Utan korrekt vägledning kan detta leda till obehagliga överraskningar i framtiden.
Även om spelbitten kan verka lockande, finns det även farhågor kring spelmissbruk och bristande konsumentskydd. Många spelare kan känna svårigheter att klaga på tjänster eller vinster, vilket gör det extra viktigt att noga överväga betalningsmetoder och säkerheten kring information. För dem som söker pålitliga alternativ har möjligheten att välja casino utan svensk licens instant bank blivit en intressant väg, där spelare kan få större trygghet och skydd.
Osäkerhet kring licenser och regleringar
Att spela på internationella plattformar innebär ofta osäkerhet, särskilt omkring licenser och regleringar som dessa aktörer följer. Många av de icke-reglerade alternativen kan sakna trovärdiga licenser, vilket innebär att spelare kan riskera att utsättas för oklara affärsmetoder och villkor. Det kan leda till registreringsproblem där individen inte har någon form av skydd.
En annan aspekt som bör beaktas är de skattemässiga aspekterna. I länder där spelverksamhet inte är reglerad korrekt kan spelare uppleva svårigheter när det kommer till att rapportera vinster. Detta kan skapa en oönskad oro kring skattekonsekvenser, som i sin tur kan påverka beslut om spelande.
Informationssäkerhet är avgörande för att skydda personlig och finansiell data. Många oreglerade plattformar kan ha bristande säkerhetsåtgärder, vilket gör att känslig information riskeras. Detta går hand i hand med otydliga villkor, där spelare kanske inte får tydlig information om hur deras data används eller skyddas.
Det är också värt att notera att klagomål är en del av spelupplevelsen. På mindre kända plattformar kan det vara svårigheter att klaga på svåra situationer, vilket kan lämna spelare frustrerade och maktlösa. Utan en effektiv klagomålsprocess förblir många frågor obesvarade.
Spelmissbruk är ytterligare en aspekt av osäkerheten kring dessa aktörer. Utan adekvat övervakning och stöd kan individer hamna i en svår situation. Många oreglerade plattformar tar inte ansvar för att erbjudande ska vara ansvarsfulla, vilket ökar risken för problem med spelande.
En annan fara är osäkerheten vid vinster. Även om en spelare vinner kan det vara problematiskt att få ut sin vinst om plattformen inte följer lagar och regler. Många spelare har upplevt avslag på uttag, vilket leder till besvikelse och förlorad tilltro.
Det är viktigt att vara medveten om bristen på konsumentskydd när man väljer att spela på oreglerade plattformar. Utan en stark juridisk ram kan spelare bli offer för orättvisa affärsmetoder och ha få möjligheter att försvara sina rättigheter.
Sammanfattningsvis är det avgörande att spelare gör noggranna överväganden kring säkerheten och rättigheterna som erbjuds i samband med internationella spelsajter. Att vara informerad är den första försvarslinjen mot potentiella fallgropar och säkerställer en tryggare spelupplevelse.
Svårigheter med att återfå förlorade medel
Att försöka återfå förlorade pengar från oreglerade plattformar kan vara en utmaning för spelare. Ofta är betalningsmetoderna begränsade och kan innebära extra avgifter, vilket ytterligare komplicerar processen. Informationssäkerhet blir också en central aspekt, då det inte alltid finns några garantier för att personliga och finansiella uppgifter hanteras på ett säkert sätt. Den osäkerhet som följer med dessa förluster kan bidra till en ökad känsla av frustration.
Otydliga villkor blir ett vanligt hinder när det gäller att kräva tillbaka medel. Spelare kan stöta på svårigheter att förstå vilka regler och förutsättningar som gäller för att erhålla sina vinster. Detta skapar en situation där många känner sig vilseledda och kanske avstår från att försöka klaga, trots att de har rättigheter. Bristande konsumentskydd är en tydlig faktor som gör att detta problem förvärras.
En annan aspekt att beakta är de skattemässiga aspekterna av vinster från dessa plattformar. Skattefrågor kan bli komplicerade och det finns ingen säkerhet för att vinsterna behandlas på ett korrekt sätt enligt lag. Detta kan leda till en obehaglig överraskning när spelare inser att de eventuellt är skyldiga att betala skatt på belopp de inte kan få tillbaka.
Spelmissbruk är också en riskfaktor, vilka ibland uppstår på oreglerade sidor där spelare inte kan få det stöd de behöver. Det kan skapa en ond cirkel av förlust och ytterligare problem när det kommer till att återfå pengar. På grund av dessa utmaningar kombinerat med svårigheterna att klaga, står spelare nästan alltid inför en osäkerhet som kan påverka både deras ekonomi och mentala hälsa.
Risker med dataskydd och personlig information
När man registrerar sig på internationella spelsajter kan användarna stöta på registreringsproblem som varierar från plattform till plattform. Ibland kan användare uppleva svårigheter med verifiering av identitet, vilket kan leda till förseningar eller till och med avvisningar av konton. Sådana hinder påverkar inte bara spelupplevelsen utan väcker också frågor kring skyddet av personlig information.
Otydliga villkor är en annan utmaning. Många speloperatörer på oreglerade marknader presenterar sina användarvillkor på ett krångligt sätt, vilket gör det svårt för spelare att förstå vilka rättigheter och skyldigheter de har. Utan tydlig information riskerar användare att ådra sig oönskade avgifter eller förlora sina vinster på grund av missförstånd.
Det är också viktigt att överväga skattemässiga aspekter. Vinsterna från spelaktiviteter på okontrollerade plattformar kan behandlas olika beroende på spelarens hemland. Detta skapar osäkerhet vid vinster, där användare kan bli överraskade av skattekonsekvenser som de inte var medvetna om när de spelade.
Bristande konsumentskydd är ett centralt problem. I avsaknad av en stark reglering har användare ofta ingen säkerhet att deras rättigheter kommer att skyddas. Det kan leda till en situation där spelare blir utsatta för oetiska affärsmetoder utan möjlighet att få hjälp.
Svårigheter att klaga kan bli en tärande faktor för spelaren. Utan organiserade kanaler för att framföra klagomål kan användare uppleva att deras problem förblir olösta. Detta kan skapa en känsla av maktlöshet och avskräcka från att spela vidare på dessa plattformar.
Informationssäkerhet är avgörande i detta sammanhang. Många användare kanske inte är medvetna om de potentiella hot som kan finnas när de delar sina personliga uppgifter. Det är viktigt att välja plattformar som investerar i robusta säkerhetsåtgärder för att skydda användarens information.
Val av betalningsmetoder spelar också en roll. Olika metoder kan ha olika nivåer av skydd och integritet. Att använda osäkra betalningslösningar kan leda till att personuppgifter hamnar i fel händer, vilket ytterligare försvårar situationen för spelarna.
Sammanfattningsvis bör spelare vara medvetna om de potentiella fallgroparna kopplade till dataskydd och hantering av personlig information. Att göra informerade val och noggrant utvärdera vilka plattformar man väljer att spela på kan bidra till att minimera riskerna och säkerställa en tryggare spelupplevelse.
Frågor och svar:
Vilka risker finns det med att spela på utländska casinon?
Att spela på utländska casinon kan medföra flera risker, inklusive oreglerad spelverksamhet, bristande konsumentskydd och svårigheter att lösa tvister. Eftersom dessa casinon ofta är registrerade i länder med laxare lagar kan spelare stå utan skydd i händelse av problem, som exempelvis att casinot inte betalar ut vinster eller att det uppkommer tvister gällande bonusar.
Hur kan jag avgöra om ett utländskt casino är pålitligt?
För att bedöma pålitligheten hos ett utländskt casino, bör du kontrollera licensinformation, läsa recensioner från andra spelare och se efter om casinot har en transparent policy för bonusar och betalningar. Ett bra tecken är också att casinot erbjuder säkra betalningsmetoder och har en kundtjänst som snabbt svarar på frågor och problem.
Vilka lagar reglerar spel på utländska casinon från Sverige?
I Sverige regleras spelverksamhet av Spelinspektionen, som utfärdar licenser och ser till att regler följs av svenska spelbolag. När det kommer till utländska casinon, gäller att det är upp till spelare att vara medvetna om de lagar som gäller, vilket innebär att det kan vara lagligt att spela på utländska sajter, men utan skyddet av svensk lagstiftning.
Kostar det mer att spela på utländska casinon?
Att spela på utländska casinon kan ibland verka billigare på grund av högre bonusar och lägre insättningskrav, men det finns risker kopplade till avgifter och valutarisker. Dessutom kan det tillkomma kostnader i form av skatter på vinster som inte kommer från licensierade svenska casinon, vilket kan påverka den totala kostnaden av ditt spelande.
Vad ska jag tänka på innan jag väljer ett utländskt casino?
Innan du väljer ett utländskt casino, bör du överväga flera faktorer såsom casinoets licens, spelutbud, bonusar och villkor, samt betalningsmetoder. Det är också bra att kontrollera om casinot erbjuder spelansvar och hur de hanterar frågor som rör spelproblem. Sammanställ gärna en lista med dina prioriteringar för att göra ett informerat val.