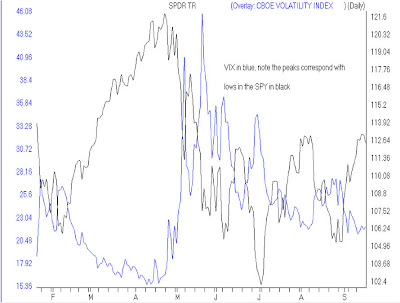
The VIX is the CBOE Volatility index and is a measure of the implied volatility of the SP500 stocks. Much is mentioned in the financial media on high levels of the VIX during steep down turns in the market. Question is can we make this into an indicator.
a quick overlay of the VIX on the SPY reveals some visual correlations with the VIX. Peaks in the VIX often correlate with bottoms in the SPYand vice verse.
To make use of the VIX as an indicator requires building an indicator using the closing price of the VIX. The EDS code to do this can be downloaded from http://aiqsystems.com/VIXSPY-spread_lasvegas.EDS save this file to c:wintes32EDS Strategies.
To add a custom indicator in AIQ Charts, open Charts and go to Charts, Settings, Indicator Library, EDS Indicators. Clickk on Add, locate the EDS file VIXSPY-spread_lasvegas.EDS in your c:wintes32EDS Strategies folder.
For Plot Type select Histogram with Plotted Line and click next.
For Description I chose VIX with 10-day av.
UDF to Plot is Close_VIX
UDF for line is VIX_10day
Click Finish and then Done.
The indicator VIX with 10-day av will now be available at the bottom of the indicator control panel.
I chose a 10-day average to help smooth out the fluctuations, a 21-day average may also work.
Here’s what it looks like
The arrows on the chart show an interpretation that works well for timing the bottoms of the SPY. I’m looking for theVIX histogram to be 3 or more consecutive spikes above the 10 day average, followed by Change in direction from up to down of the 10 day average. Check it out for yourself and see what you think.


