There are a virtually unlimited number of ways to play the financial markets. This is especially true in the area of options trading, where a bullish trader can pick from at least at a dozen different strategies (buy call, buy a bull call spread, sell a bull put spread, collar, out-of-the-money calendar spread, etc., etc.).
At some point it can all become a bit overwhelming to the quote, unquote, “average investor.” So sometimes the place to start is, well, anywhere, so long as that anywhere has a beginning and an end and a logical progression to it. What does that mean? It means I am going to walk through “one way to play.” I make no claim that it is the “best” way, or even a “great” way. But that’s OK because the purpose here is not for you to rush out and start trading with it, but rather to stimulate your own thinking on the subject. In other words, hopefully in reading this a “light” will go on for you in regards to your own trading. So here goes.
Jay’s “Light” Option Trading Strategy
This strategy involves a set of steps designed to generate a bullish option trade based on a logical set of criteria. For this strategy we will look for a couple of things:
1. A “catalyst” to tell us when to buy call options.
2. Stocks that enjoy good option trading volume and tight bid-ask spread.
3. Stocks that are performing well overall.
4. Stocks that have experienced a recent pullback and may now be due for a bounce.
#1. The “Catalyst”
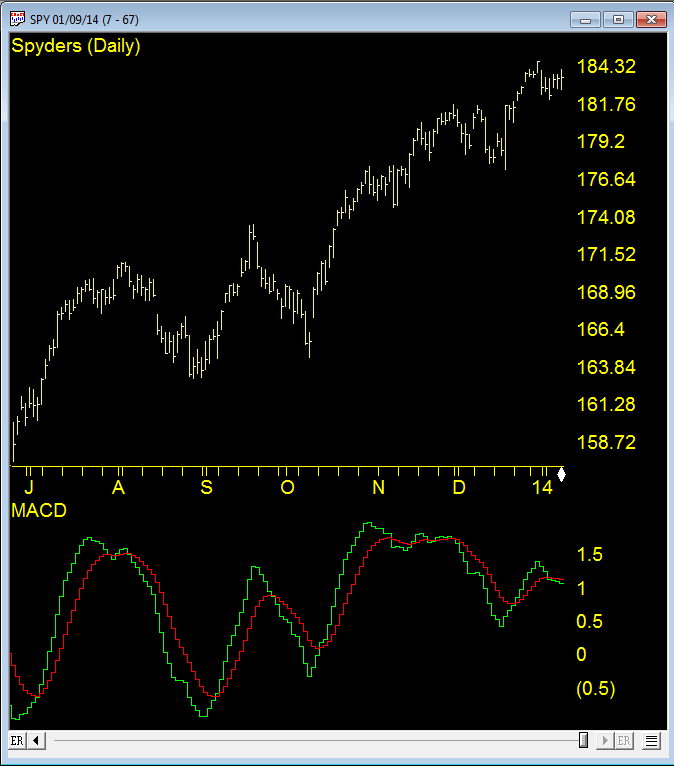
We will look for ticker SPY to be above its 200-day moving and for the 3-day RSI to drop to 20 or below and then reverse to the upside. Figure 1 displays a number of such signals.
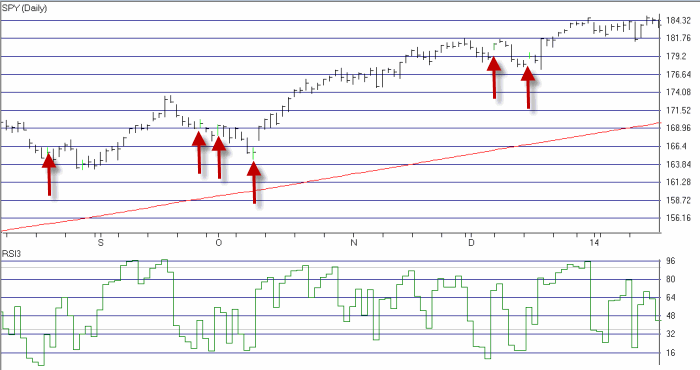 Figure 1 – “Catalyst” Buy Signals (Courtesy AIQ TradingExpert)
#2. Stocks with good option volume and tight bid/ask spreads.
In Figure 2 we see the “Stock List Filter” report from www.OptionsAnalysis.com. This list contains 493 stocks that trade at least 1,000 options a day and those options have an average bid/ask spread of less than 2% (only the top part of the list is visible in Figure 2).
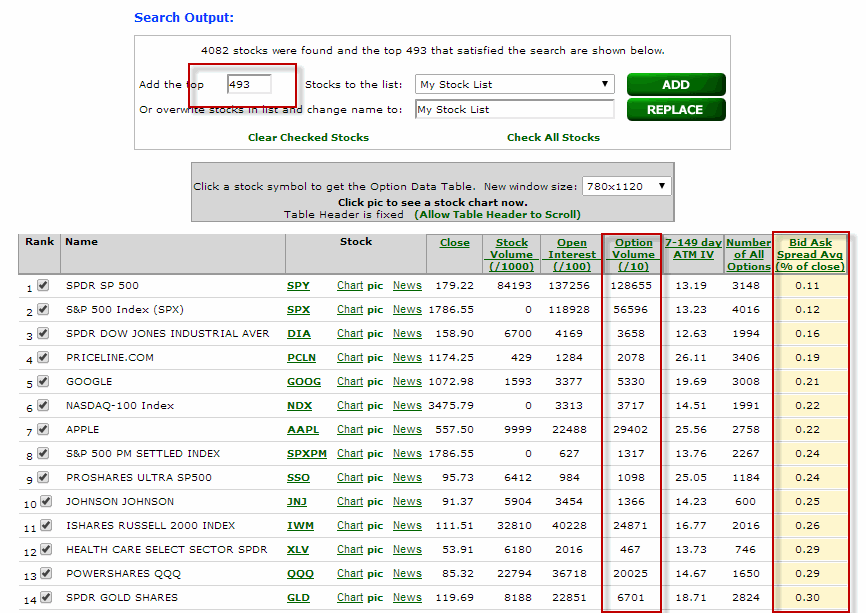 Figure 2 – Stocks with good option volume and tight bid/ask spreads (Courtesy: www.OptionsAnalysis.com)
#3. Stocks that are performing well overall
Next we take the stocks shown in Figure 2 and run them through the “Channel Finder” routine in www.OptionsAnalysis.com. We will look for the top 100 stocks based on the strength of their “Up Channel”. We overwrite “My Stock List” with just those 100 stocks. The output list appears in Figure 3.
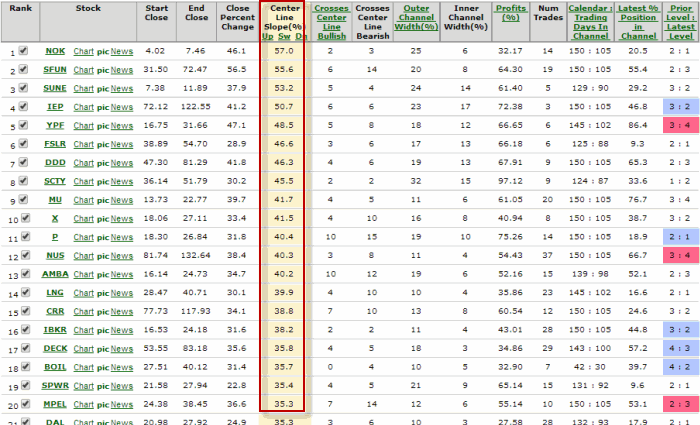
In Figure 4 we see ticker SFUN with a very strong recent Up Channel
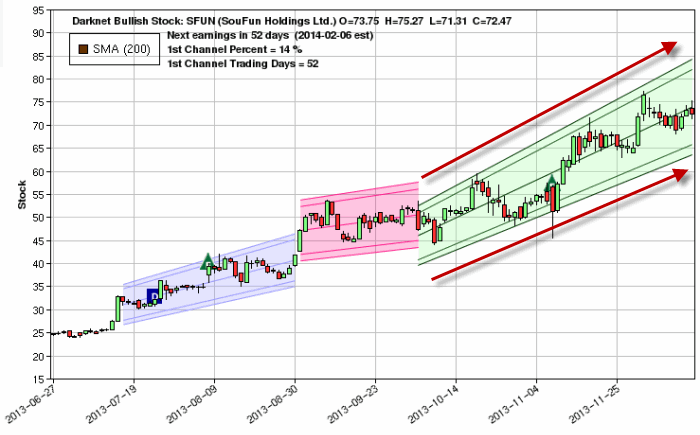 Figure 4 – Ticker SFUN with Up Channel (Courtesy: www.OptionsAnalysis.com)
#4. Stocks that have experienced a “pullback”
Lastly, we will look through the 100 stocks still on our list for those that have experienced a 3-day RSI of 35 or less within the past 5 trading days. As you can see in Figure 5, only 19 stocks now remain for consideration.
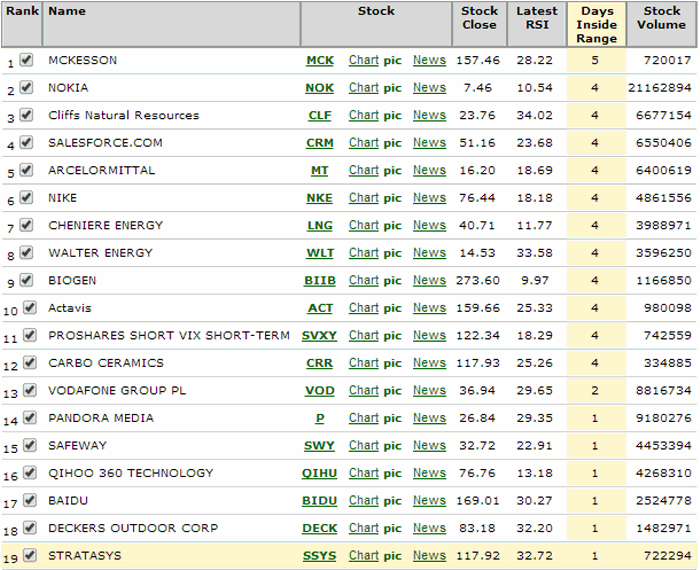 Figure 5 – Stocks that have had a 3-day RSI reading of 35 or less in past 5 days (Courtesy: www.OptionsAnalysis.com)
The Next Step: Finding a Trade
From here a trader can use whatever bullish option strategy they prefer to find a potentially profitable trade among these 19 stocks. For illustrative purposes we will:
-Consider buying calls with 45 to 145 days left until expiration and Open Interest of at least 100 contracts.
-Initially sort the trades by a measure known as “Percent to Double”, as in “what type of percentage move does the underlying stock have to make in order for the option to double in price?”
-Once we get that list e will sort by “Highest Gamma” in an effort to get the most “bang for the buck.”
We see the output list in Figure 6.
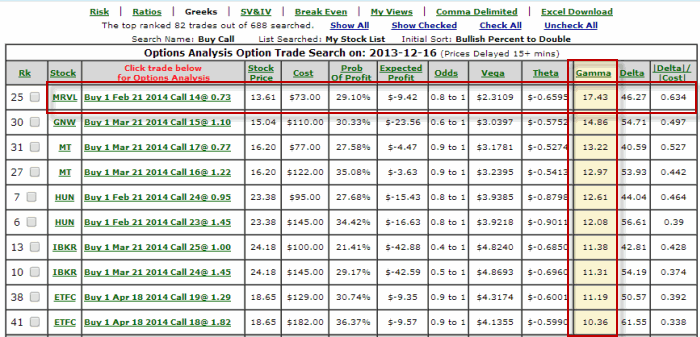
The top trade listed in to buy the MRVL Feb 2014 14 Call @ $0.73 (or $73 per option)
In Figure 7, we see that MRVL rallied nicely within a few weeks from 13.61 to 15.81.
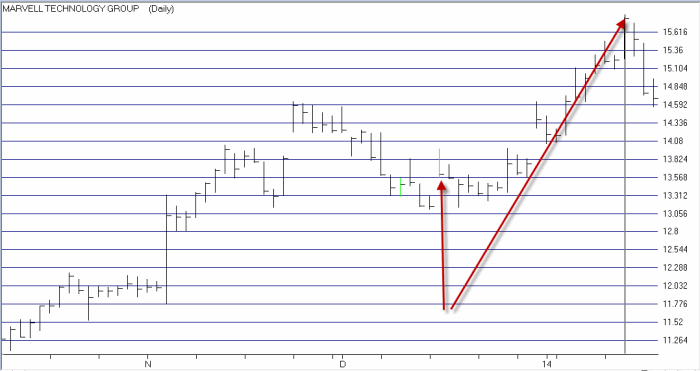 Figure 7 – MRVL rallies (Courtesy: www.OptionsAnalysis.com)
In Figure 8 we see that the Feb 14 call option gained 169.9%.
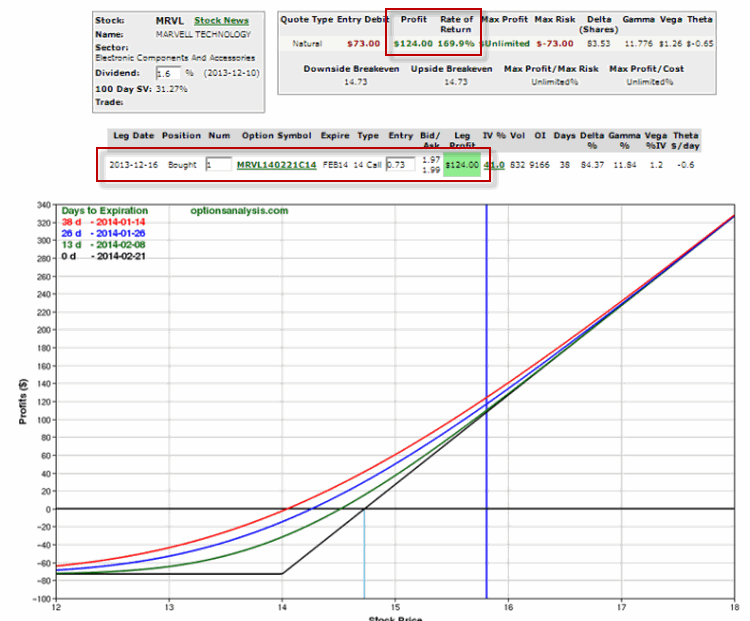 Figure 8 – MRVL 14 call rallies sharply (Courtesy: www.OptionsAnalysis.com)
Of course there is also the whole topic of what to do with this trade: close it, sell some, adjust it, etc. Sorry folks, that’s beyond the scope of this article.
Summary
So does every trade work out this well? That reminds me of a joke. A salesman rings he doorbell of a home and a 12–year old boy answers the door. The boy has a beautiful woman on each side, a drink in one hand and a big cigar in his mouth. Momentarily stunned the salesman finally manages to ask hesitantly, “Um, is your mother home?”
The boy removes the cigar from his mouth, looks straight at the salesman and asks, “What do you think?”
Same answer here. Still, a logical set of steps is a good place to start.
Jay Kaeppel
on futures, option and stock trading. He was Head Trader for a CTA from
1995 through 2003. As a computer programmer, he co-developed trading
software that was voted “Best Option Trading System” six consecutive
years by readers of Technical Analysis of Stocks and Commodities
magazine. A featured speaker and instructor at live and on-line trading
seminars, he has authored over 30 articles in Technical Analysis of
Stocks and Commodities magazine, Active Trader magazine, Futures &
Options magazine and on-line at www.Investopedia.com.