April 4, 2022
Hello Everyone,
I am now a Partner at American Strategic Advisors in Stamford Connecticut.
Now to the the important news that will continue to affect all of us.
1. Putin and the Russians continue to penetrate and choke off the cities of Ukraine although there are talks of a cease fire.. This will most likely continue until the Ukranians give up, Putin gives up or there is an escalations that can be a disaster.
2. As reported on CNBC, Inflationary pressures are 6-7% plus should continue to weigh heavily on the economy and overall costs in the USA.
3. Interest rates will continue to rise at least 3 to 5 more time unless the data changes
4. Earnings will slow if the war continues and inflation does not subside. This could cause a Global Recession
5. Overall the citizens of the USA want to travel and to spend money but they are being suppressed by the uncertainty of war, higher interest rates, higher inflation and spiking energy costs.
Earnings are expected to continue to grow this year about 3 to 7%, but after the bounce in the stock market over the last 2 weeks the market is getting overbought again somewhat and getting near resistance. The market can continue to rally from here, BUT now I would consider reducing equity positions as there are too many head winds in the market that could become a problem in the next few weeks and months. The stocks that tend to do well in an inflationary environment are stocks that have pricing power. These companies can raise prices somewhat and people will continue to use their products. As prices go higher people tend to buy other substitute products. If you are nearing or in retirement, I would consider reducing equities by 5 to 10% to fixed accounts if you are over allocated to equities. I still like energy, and dividend stocks and over the longer term higher quality technology stocks.
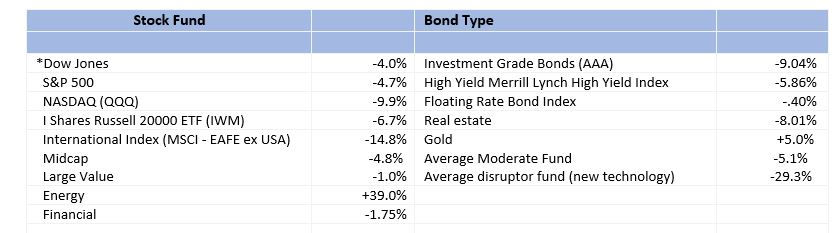
Some of the INDEXES of the markets both equities and interest rates are below. The source is Morningstar.com up until April 1, 2022 These are passive indexes.
Excerpts from Dr. Robert Genetski
Market Outlook
Nervous investors continue to produce highly erratic moves in stock prices. This week started
with substantial gains, then ended by giving back the gains. By yesterday, most stocks ended the week unchanged.
Daily moves in stock prices are usually in response to major news events. The gains earlier in the week appear consistent with a promise that peace talks could end the war. The declines later in the week were consistent with a lack of progress in the talks and with Russian troops being exposed to radiation at Chernobyl.
Most technical stock market indicators remain negative. The S&P500 is in the best shape since it is the only major index above its 200-day average. All others have failed to move above key resistance levels.
Economic indicators for March point to moderate growth of 2% to 3%. Rapid inflation continues to eat away at increases in spending and incomes. After a sharp increase, longer-term interest rates have leveled off. The spread between the 2-year Treasury and the 10-year Treasury is currently a mere 0.01 percentage point. The narrowing of this spread suggests the Fed will be able quickly to contain inflation by rapidly raising short-term rates. This is highly unlikely.
Although the flood of money entering the economy slowed a bit in March. It will take much more than slowing to offset the surge this past year. With little change the S&P500, the index remains 29% above its underlying value. Investors should remain cautious in a highly erratic news driven market.
A Look Back
Today’s March employment report shows a strong rise of 426,000 private payroll jobs, a 4% annualized increase. Average weekly earnings increased at a 5% annual rate and the unemployment rate declined to 3.6%. As expected, the economy continues to perform well.
Forces Impacting the near term outlook for stock prices
Economic Fundamentals Mixed
Stock Valuation Over-Valued 29%
Monetary Policy: Highly Expansive
Recommended Stock Exposure: 60%
This is a reduction of his stock allocation.
Dr Robert Genetski, American Strategic Advisors and LPL Financial are not affiliated. The opionions expressed in this material do necessarily reflect the views of LPL Financial.
S&P 500 Charts Source: AIQSystems.com
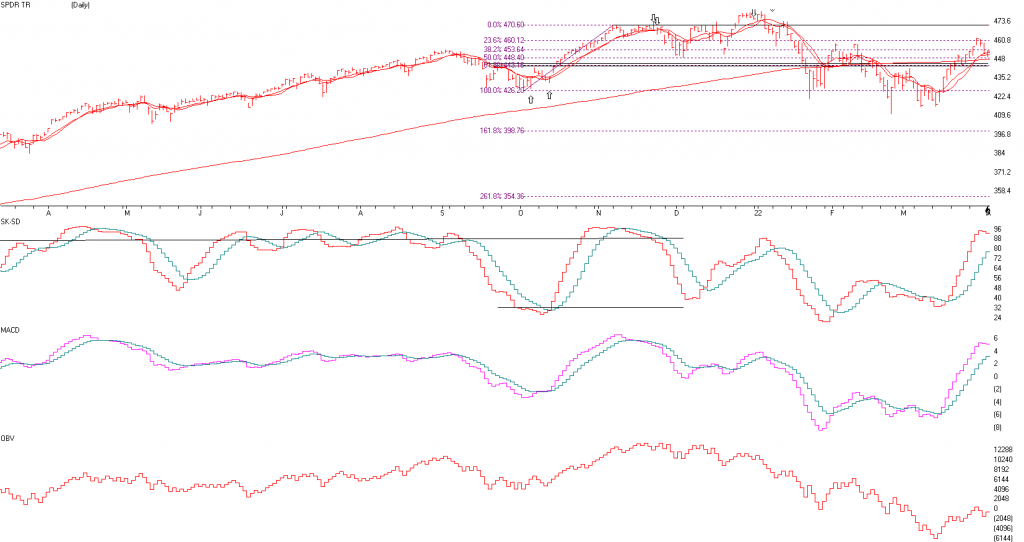
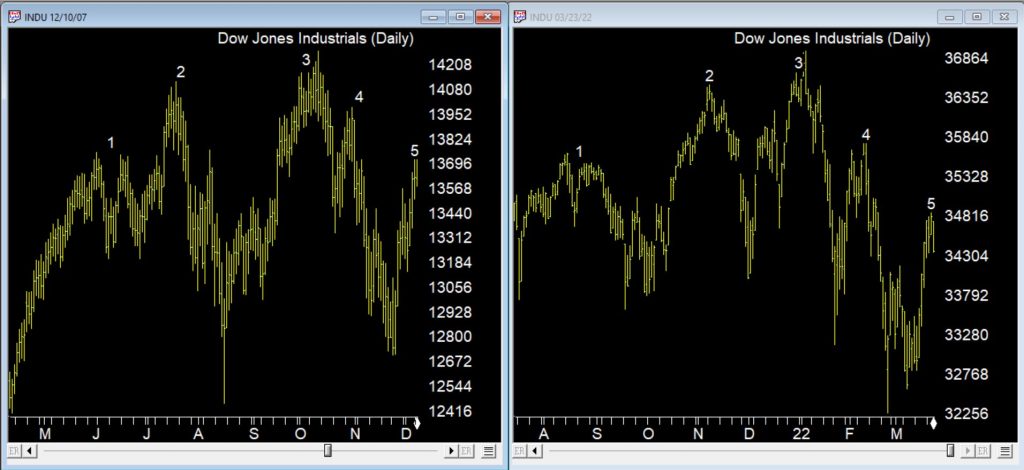
The S&P 500 is above. As you can see it has rebounded over the last month where the AIQ Systems gave BUY signals on March 10th but it is again flashing topping action again. The S&P is masking what is happening to the very aggressive stocks that have fast revenue growth but no real earnings as of yet and have dropped 30% or more. Over the longer term I am still Bullish, but over the next few months I do not see any new highs in the S&P 500. I see the S&P not going above the old high and actually trying to test the 4200 level again on the S&P 500. So, any rally in the markets may be to REDUCE equities. In addition, we will probably not have a recession this year, but in 2023 the chances go up for a recession. Stick with companies with solid earnings.
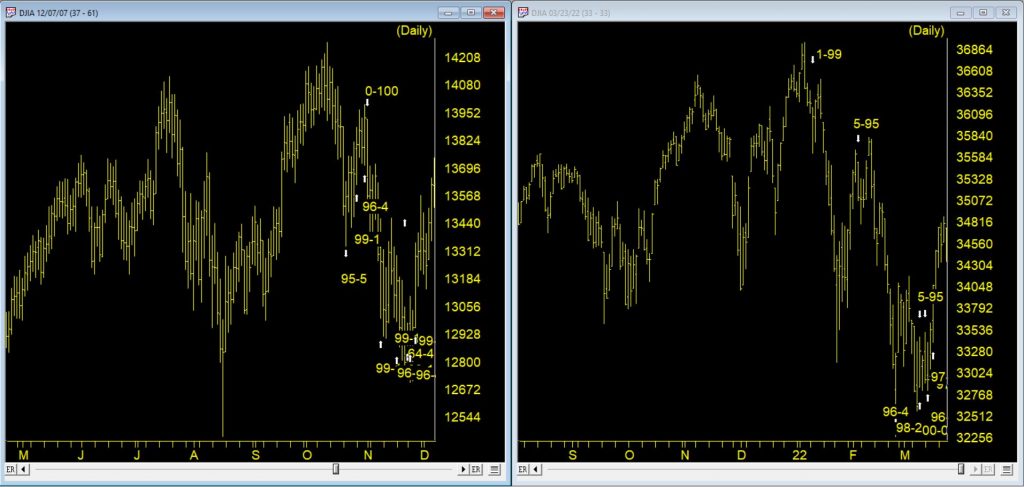
The SK-SD Stochastics chart is again getting very overbought as the fast line is now over 88 and getting overbought. MEANING?, the market is getting short term overbought again. See the ABOVE pointing Arrows? Everytime the SK-SD Stochatisc was above the 88 line the market topped out short term! Meaning I’m CAUTIOUS here, consider selling a little above the 88 line, where it is now.
MACD or Momentum line. Momentum is still going higher. The BUY signal was when the pink line crossed the Aqua line in early March, but now it has gone up a good deal. My AIQ models are NOT confirming Sell signals, I am saying they are flashing topping action.
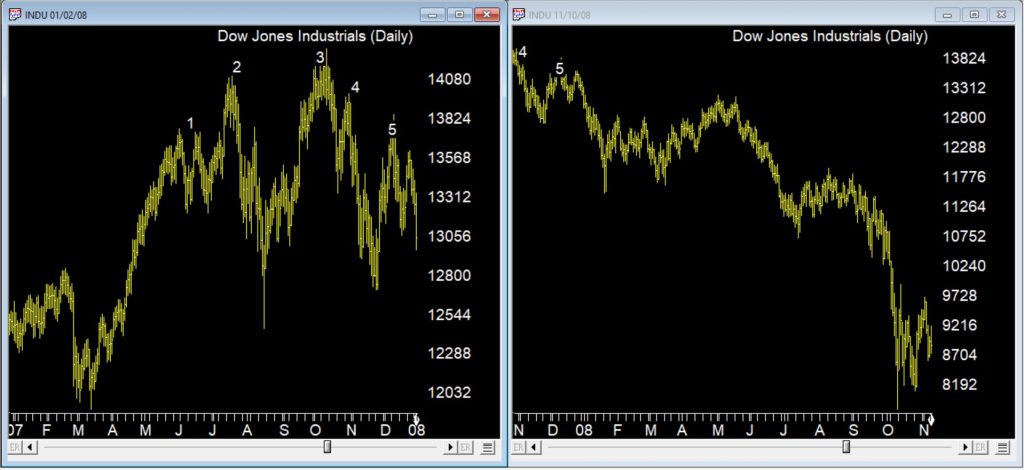
The last chart is On Balance Volume. This chart shows as markets go up all volume is added and when markets fall then all volume is subtracted. Notice volume is not that great when markets are rising. It should at least follow the market above and it is not.
Bottom Line
The market has had one of the worst quarters in a few years. The cause? Overvaluation, Higher Interest rates, INFLATION, Covid and the Russian situation. If interest rates rise 5 to 7 times like the Federal reserve says then regular bonds may be a SELL, and the only bonds I might consider FLOATING RATE BONDS. In addition if interest rates rise then financials tend to perform better then most. In addition, stocks with pricing power and with good consistent earnings do better than aggressive companies that have potential but no earnings. Commodities tend to do well in an inflationary environment. Look for companies with revenue growth that has the potential of beating inflation. I am still long term bullish but the short term could get very volatile where we could go a little higher on the markets but there is a good potential of testing the 4200 level on the S&P 500 again later in the year.. I am Cautious on the market over the next few months. If the market sells off and interest rates have gone up substantially then at the peak of pessimism begets bottoms in the market. I will continue to do my analysis and inform you when a bottom looks iminant.
P
Support levels on the S&P 500 area are 4250, 4200, and 3800- 3850 areas and 3500. These might be BUY areas.
Please call me for a Review if you have not seen me in 6 months, it is important.
The Best to all of you,
Joe
Joe Bartosiewicz, CFP® Investment Advisor Representative
Partner Wealth Manager, American Strategic Advisors,263 Tresser Blvd, Ste 100, Stamford CT
860-940-7020
SECURITIES AND ADVISORY SERVICES OFFERED THROUGH LPL Financial, a registered investment advisor, MEMBER FINRA/SIPC.
Charts provided by AIQ Systems:
Technical Analysis is based on a study of historical price movements and past trend patterns. There is no assurance that these market changes or trends can or will be duplicated shortly. It logically follows that historical precedent does not guarantee future results. Conclusions expressed in the Technical Analysis section are personal opinions: and may not be construed as recommendations to buy or sell anything. The economic forecasts set forth in this material may not develop as predicted and there can be no guarantee that strategies promoted will be successful. Each clients investment experience is unique to their circumstance and must be carefully planned with their advisor.
Disclaimer: The views expressed are not necessarily the view of LPL Financial or American Strategic Advisors, Inc. and should not be interpreted directly or indirectly as an offer to buy or sell any securities mentioned herein.Past performance cannot guarantee future results. Investing involves risk including the potential loss of principal. No investment strategy can guarantee a profit or protect against loss in periods of declining values. Please note that individual situations can vary. Therefore, the information presented in this letter should only be relied upon when coordinated with individual professional advice. *There is no guarantee that a diversified portfolio will outperform a non-diversified portfolio in any given market environment. No investment strategy, such as asset allocation, can guarantee a profit or protect against loss in periods of declining values.
It is our goal to help investors by identifying changing market conditions. However, investors should be aware that no investment advisor can accurately predict all of the changes that may occur in the market.
The price of commodities is subject to substantial price fluctuations of short periods of time and may be affected by unpredictable international monetary and political policies. The market for commodities is widely unregulated and concentrated investing may lead to Sector investing may involve a greater degree of risk than investments with broader diversification.
Indexes cannot be invested in directly, are unmanaged and do not incur management fees, costs, and expenses.
Dow Jones Industrial Average: A price weighted average of 30 significant stocks traded on the New York Stock Exchange and the NASDAQ.
S&P 500: The S&P 500 is an unmanaged indexed comprised of 500 widely held securities considered to be representative of the stock market in general.
NASDAQ: the NASDAQ Composite Index is an unmanaged, market weighted index of all over the counter common stocks traded on the National Association of Securities Dealers Automated Quotation System
(IWM) I Shares Russell 2000 ETF: Which tracks the Russell 2000 index: which measures the performance of the small capitalization sector of the U.S. equity market.
The Merrill Lynch High Yield Master Index: A broad based measure of the performance of non-investment grade US Bonds
MSCI EAFE: the MSCI EAFE Index (Morgan Stanley Capital International Europe, Australia and Far East Index) is a widely recognized benchmark of non US markets. It is an unmanaged index composed of a sample of companies’ representative of the market structure of 20 European and Pacific Basin countries and includes reinvestment of all dividends.
Investment grade bond index: The S&P 500 Investment grade corporate bond index, a sub-index of the S&P 500 Bond Index, seeks to measure the performance of the US corporate debt issued by constituents in the S&P 500 with an investment grade rating. The S&P 500 Bond index is designed to be a corporate-bond counterpart to the S&P 500, which is widely regarded as the best single gauge of large cap US equities.
Floating Rate Bond Index is a rules based, market-value weighted index engineered to measure the performance and characteristics of floating rate coupon U.S. Treasuries which have a maturity greater than 12 months.
The opinions voiced in this material are for general information only and are not intended to provide specific advice or recommendations for any individual. All performance referenced is historical and there is no guarantee of future results. All indices are unmananaged an may not be invested into directly. Stock investments include risks, including fluctuations in market price and loss of principal. No strategy assures success or protects against loss. Because of their narrow focus, secot investing includes risk subject to greater volatility than investing more broadly across multiple sectors.