There are a lot of things that don’t make sense these days. In fact, where would one even begin? So let’s move past all of that and look at something else that doesn’t seem to make sense one the face of it – i.e., the “Odd Couple” relationship between biotech and gold stocks.
The BIOGOLD Index
Using AIQ TradingExpert software I created my own “index” called “BIOGOLD” that simply combines ticker FBIOX (Fidelity Select Biotech) and ticker FSAGX (Fidelity Select Gold). The index appears in Figure 1.
Editors note: Creating your own index is a function of creating a group list in AIQ Data Manager. Information on creating lists and groups can be found in this PDF on p 11 of 14.
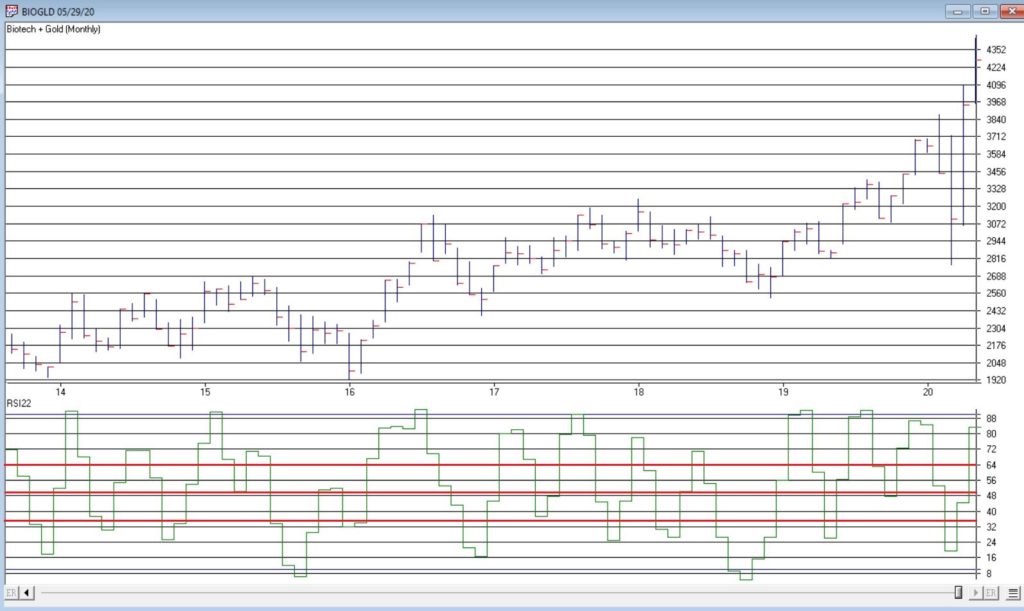
Figure 1 – Jay’s BIOGOLD Index (Courtesy AIQ TradingExpert)
Also included in the lower clip is an indicator referred to as RSI32, which is the 2-day average of the standard 3-day RSI. The levels of 65, 50 and 35 are highlighted in red for reasons detailed below.
The Rules
For the record, I have changed “the rules” a few times over the years. Call it curve-fitting if you’d like, but the goal is to generate the timeliest signals. The rules now are as follows:
A “buy signal” occurs when either:
*The RSI32 drops to 35 or below
*The RSI32 drops below 50 (but not as low as 35) and then reverses to the upside for one month
After either of the buy signals above occurs, buy BOTH FBIOX and FSAGX
*After a buy signal, sell both funds when RSI32 rises to 64 or higher
To test results, we will:
*Assume that after a buy signal both FBIOX and FSAGX are bought in equal amounts
*We will assume that both funds are held until RSI32 reaches 64 or higher (i.e., there is no stop-loss provision in this test)
For testing purposes, we will not assume any interest earned while out of the market, in order to highlight only the performance during active buy signals. Figure 2 displays the hypothetical growth of $1,000 (using monthly total return data) using the “system”.
NOTE: All results are generated using total monthly return data for FBIOX and FSAGX, except for May 2020 which is based on price action only (my source of total return data does not update until sometime in June).
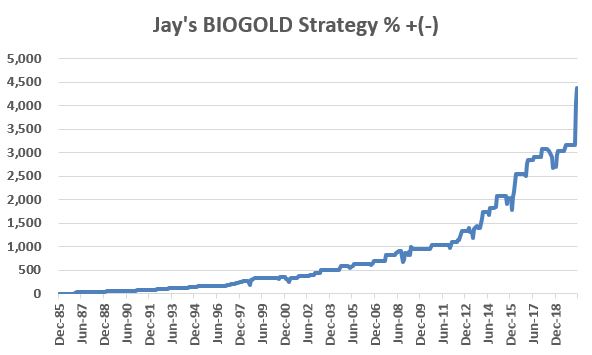
Figure 2 – Cumulative hypothetical % growth using Jay’s BIOGOLD System (1986-present)
*The most recent BUY signal occurred at the end of March 2020 when the RSI32 indicator for BIOGOLD closed at 33.67.
*The most recent SELL signal occurred at the end of May 2020 when the RSI32 indicator for BIOGOLD closed at 76.96.
Figures 3 and 4 display the price action for FBIOX and FSAGX during this two-month period.
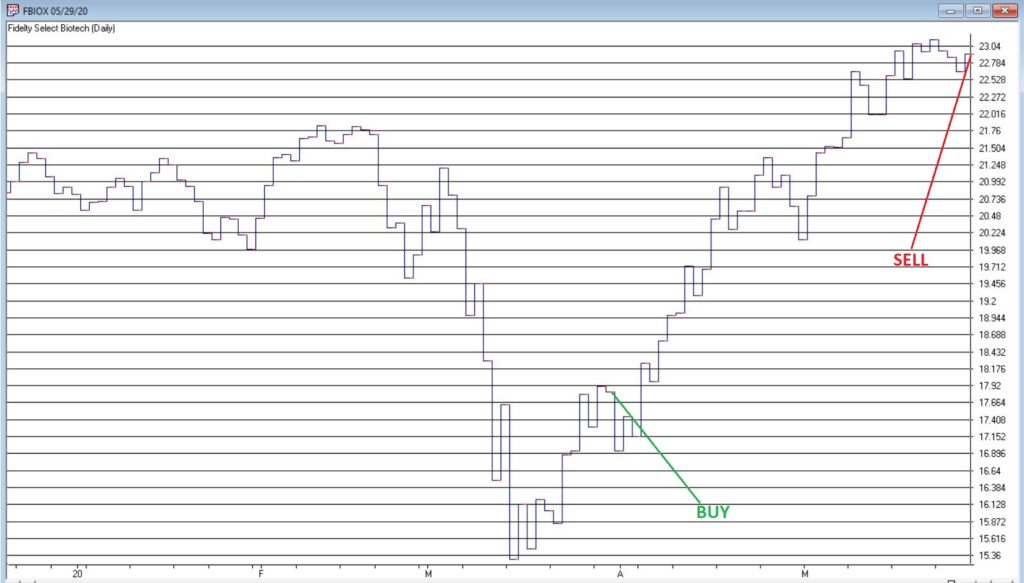
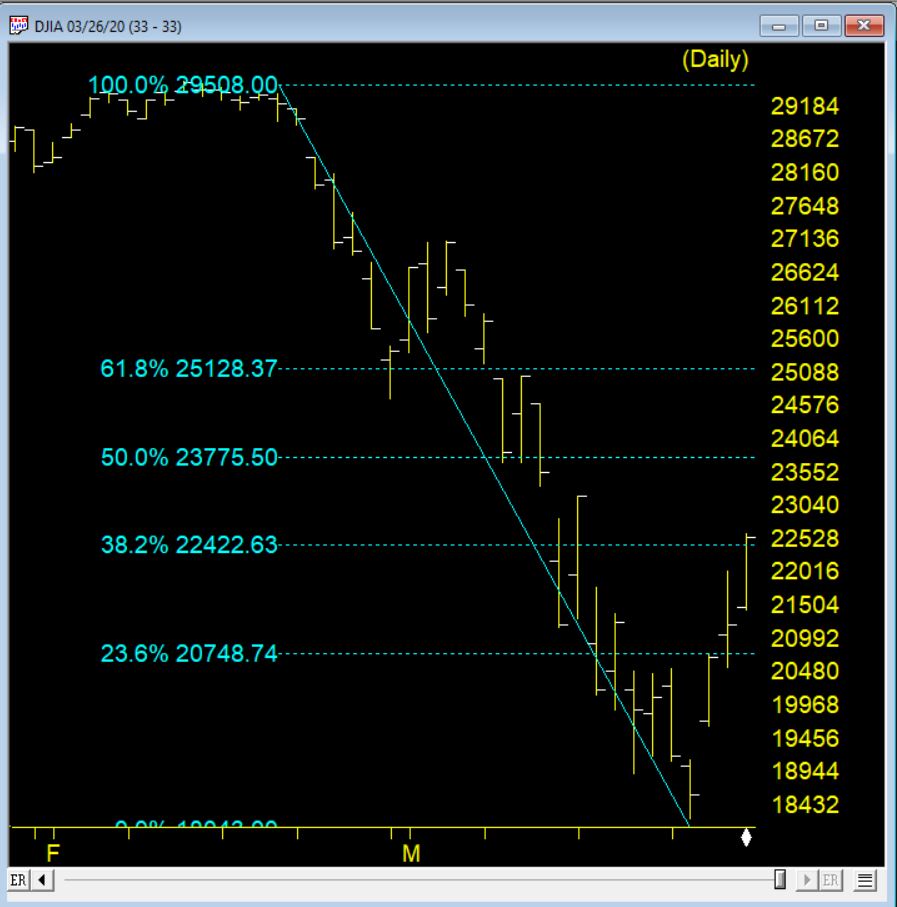
Figure 3 – Ticker FBIOX (Courtesy AIQ TradingExpert)
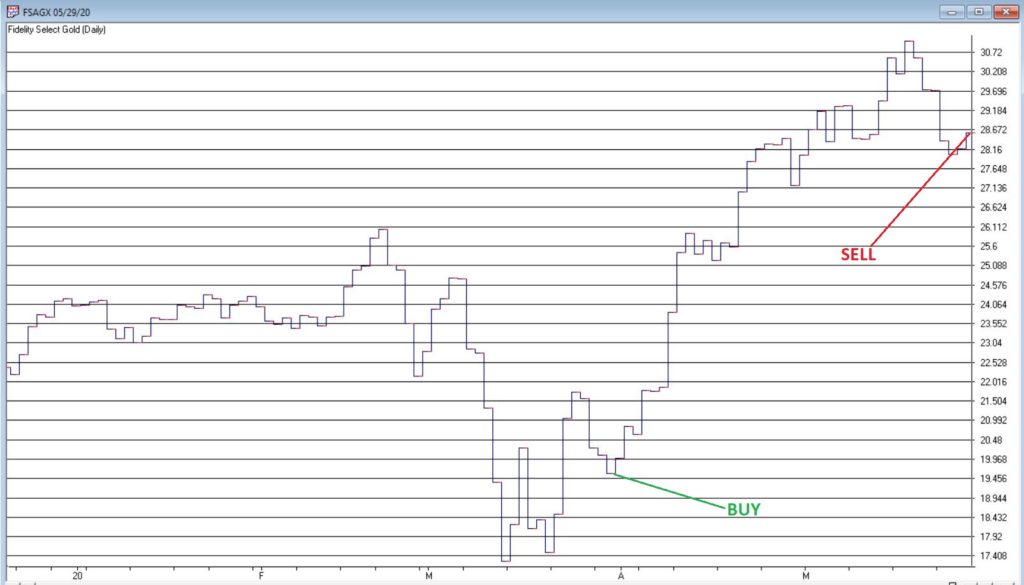
Figure 4 – Ticker FSAGX (Courtesy AIQ TradingExpert)
Summary
Is this really a viable approach to investing? That’s not for me to say. But it seems to do a pretty good job of identifying favorable times to be in with that “Odd Couple” of biotech and gold. So there’s that…
See also Jay’s “A Strategy You Probably Haven’t Considered” Video
See also Video – The Long-Term…Now More Important Than Ever
Jay Kaeppel
Disclaimer: The information, opinions and ideas expressed herein are for informational and educational purposes only and are based on research conducted and presented solely by the author. The information presented represents the views of the author only and does not constitute a complete description of any investment service. In addition, nothing presented herein should be construed as investment advice, as an advertisement or offering of investment advisory services, or as an offer to sell or a solicitation to buy any security. The data presented herein were obtained from various third-party sources. While the data is believed to be reliable, no representation is made as to, and no responsibility, warranty or liability is accepted for the accuracy or completeness of such information. International investments are subject to additional risks such as currency fluctuations, political instability and the potential for illiquid markets. Past performance is no guarantee of future results. There is risk of loss in all trading. Back tested performance does not represent actual performance and should not be interpreted as an indication of such performance. Also, back tested performance results have certain inherent limitations and differs from actual performance because it is achieved with the benefit of hindsight.