Category Archives: stock market

It’s all relative you see

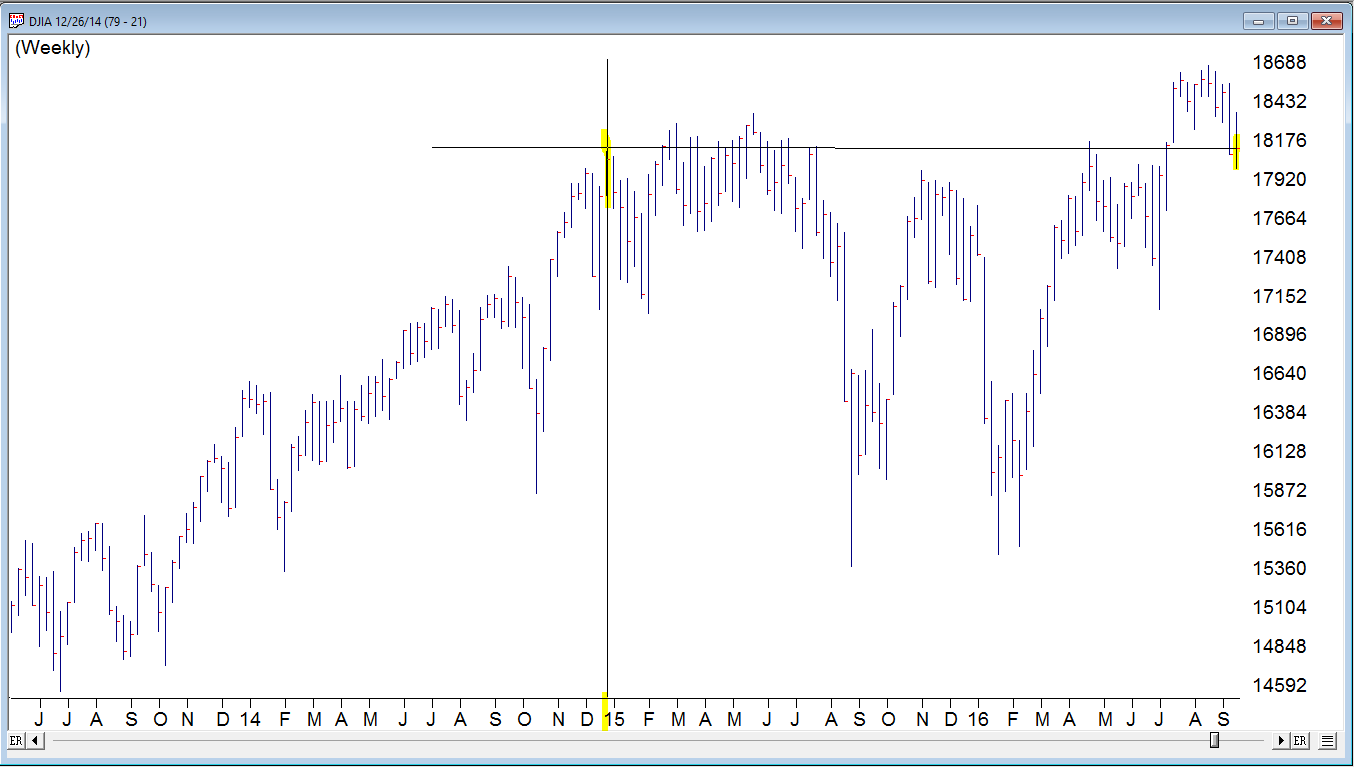
The markets have been shall we say been less than inspiring recently. Brexit came and went with a brief hiccup in the action and only in the last week or so has the volatility picked up. The Dow as you can see in this weekly chart is back the same level as December 2014


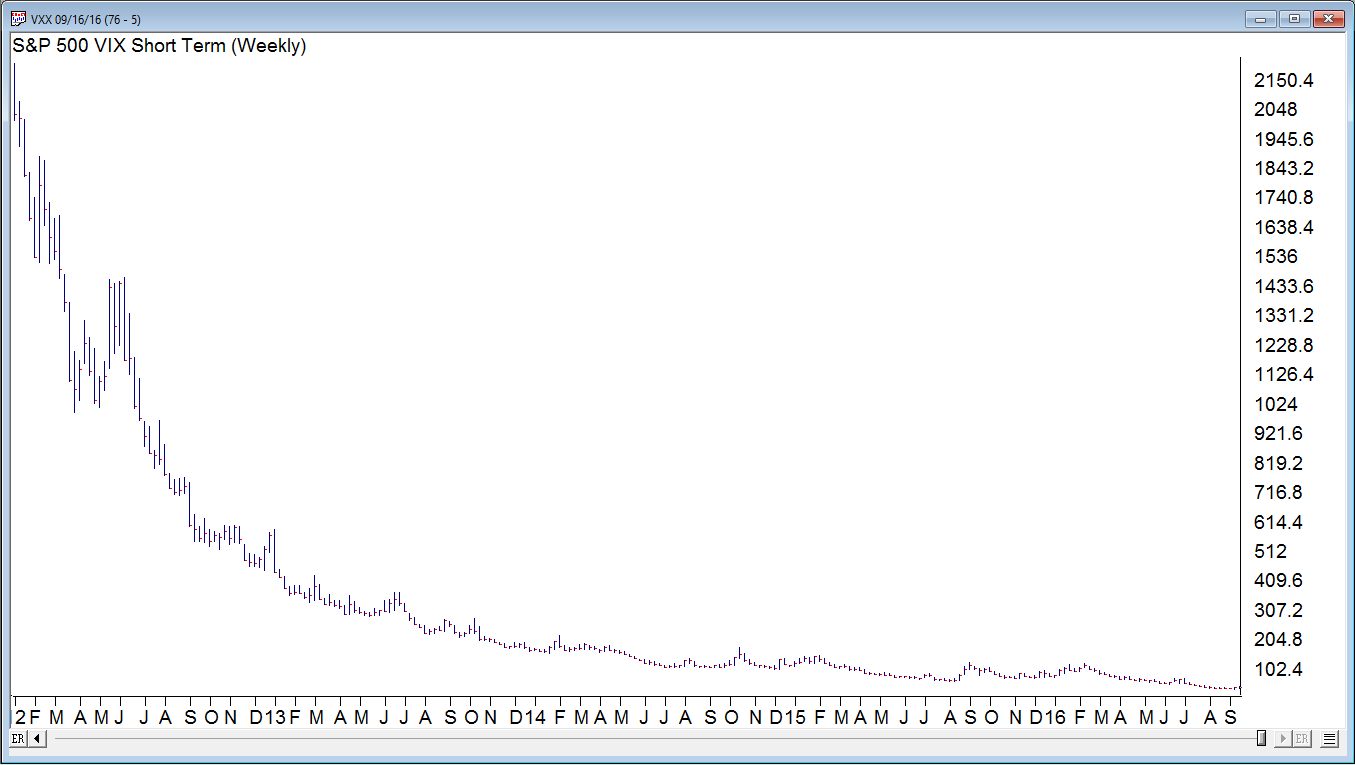
The VXX shows clearly the decline in volatility since the high back in 2011


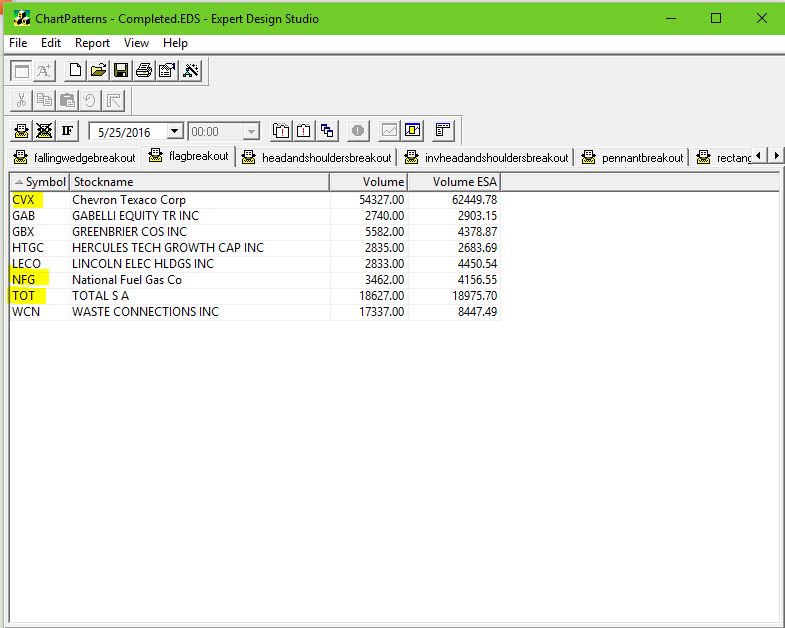
The summer doldrums may be over, but during periods when the market is range bound, segments within the market are often performing very well or very poorly. One AIQ Report that can show the strength within segments is the Relative Strength Strong – Short Term. This report shows stocks in 3 month trend up and is a great report for those who trade with ‘the trend is your friend’. Here is Friday 9-16-2016 report. The report is ranked by the stocks with the best trend.


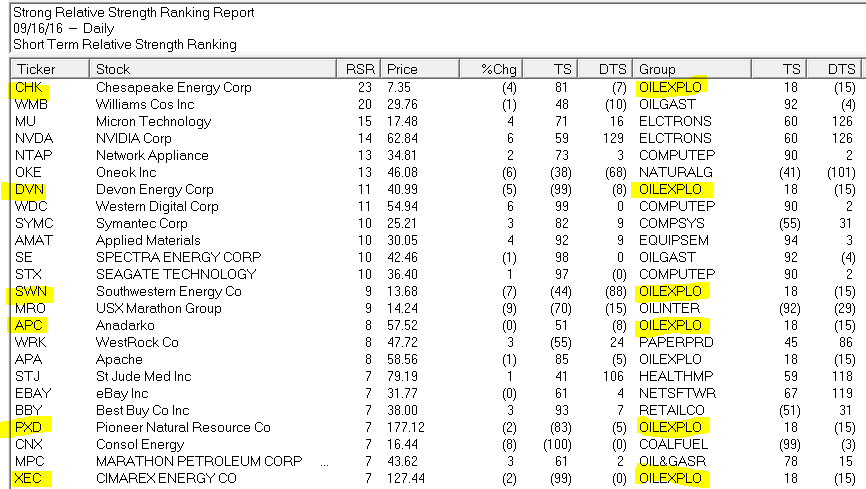
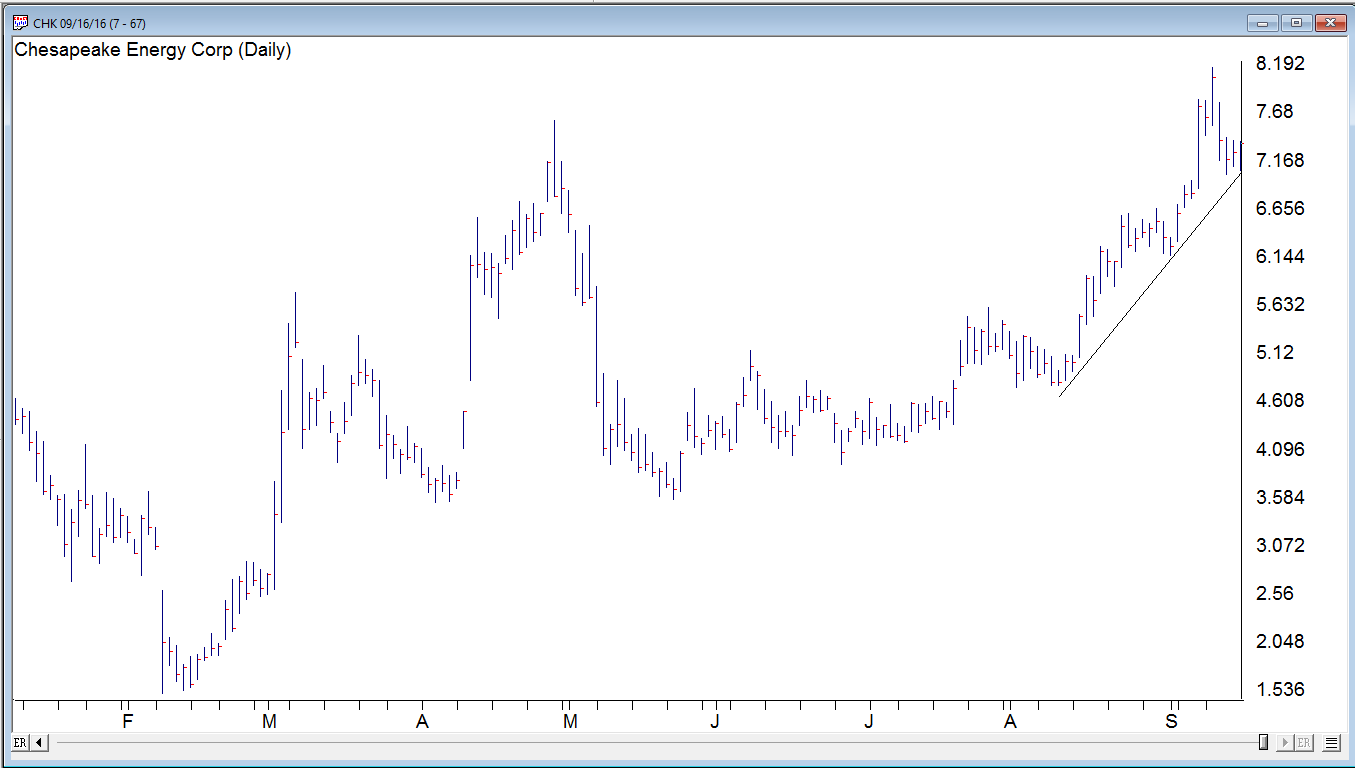
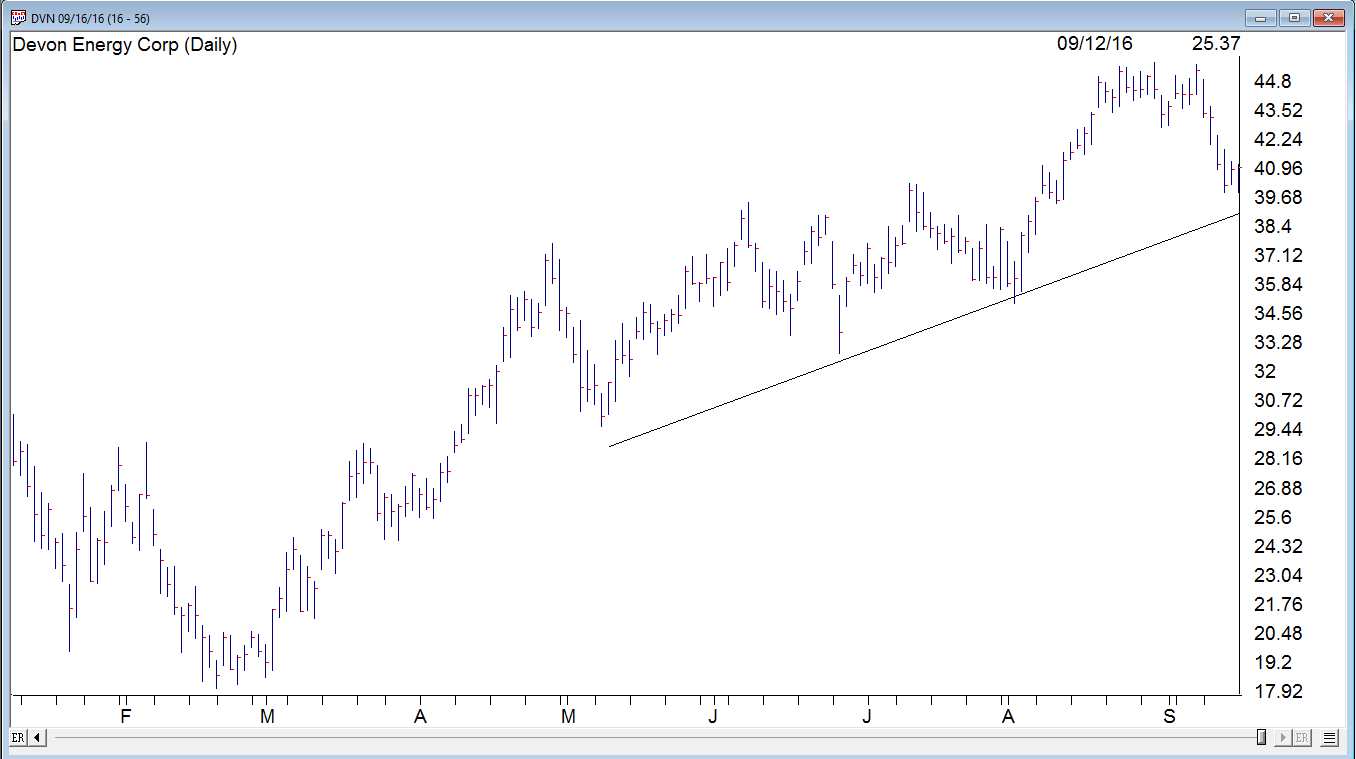
I highlighted 6 stocks in the top of this report. All have good trends in place, and all in the Oil and Exploration S&P 500 group. The group has performed quite well recently. The top 2 OILEXPO stocks CHK and DVN have both had a small pullback to their uptrend line. We’ll see how they do this week.


Chart Pattern Recognition – Lock in 2008 pricing 5 days remaining!

Why add Chart Pattern to your TradingExpert Pro? 

 
  • Over 3000 stocks tracked
  • 16 different patterns tracked
  • 6 gauges of each pattern's quality
  • Automatically generate report every night
  • Built in EDS file so you can backtest and add to your own strategy
  • Completed and emerging patterns
​​​​​​​
OR CALL AIQ SALES on 1-800-332-2999 or 775-832-2798
 
 LOCK in 2008 pricing
 

hfwacp7-13-16

 
If you order before July 31, 2016
you'll get the 2008 pricing!
 
 
OR CALL AIQ SALES on 1-800-332-2999 or 775-832-2798

Classic Flag Breakouts on CVX, NFG, TOT

Our Chart pattern Recognition tool had a wealth of gasoline related stocks have breakouts yesterday. The classic flag breakout on good volume could be seen on CVX, NFG and TOT.

Quick reminder on what a flag pattern is.

The flag pattern is considered a continuation pattern after a consolidation period. The flag is a rectangular shape, similar to  the pennant, but the pennant looks more like a triangle.

Usually there’s a strong price movement followed by sideways price movement which is the flag. The pattern is complete when prices breakout in the same direction as the initial price movement. The following move will be in the same direction as the prior sharp move. The move prior to the flag is called the pole.

The flag pattern forms a rectangle with two parallel trendlines that act as support and resistance for the price until the price breaks out. Usually the flag will slope in the opposite direction to the trend.

The buy or sell signal occurs when the price breaks through the support or resistance level, with the trend continuing in the same direction as the pole. The breakthrough should occur on heavier volume.

I’ve put all three charts together and you can clearly see the pole, flag and breakout. As noted above the volume on the breakout on TOT was reasonable. The Quality of the pattern was also considered high.

Incidentally the volume on NFG and CVX was not as significant.

The entire list of stocks that generated completed flags in our nightly report on 5/25/16 is below.

and check out this new video that shows how we automate this reporting every night using the Chart Pattern recognition plug-in for TradingExpert.

Tired of staring at charts time and time again? We have an app for that

Tired of staring at charts time and time again, not certain what is setting up?
Check out this chart of FITB, Fifth Third Bancorp, How would you have traded this over the last 6 months?
Image
What if you had a tool that shows you the exact pattern that’s setup AND includes the direction the breakout is likely to be? A tool that generates a report every night of chart patterns that have completed and are breaking out. 
​​​​​​​
 Wouldn’t that simplify your trading?
Check out this completed falling wedge pattern from 02/12/16. You would have been alerted to this breakout on 2/12/16, the direction indicator suggested that prices will rise and they did.
 
Image
Or this inverse head and shoulders on 3/1/16, the direction indicator suggested prices would rise and they did.
Image
and check out this new video that shows the most recent price pattern we were alerted to on FITB on 5/13/16 AND how we automate this reporting every night.