As the primary currency recognized around the globe, the U.S. Dollar is pretty important. And the trend of the dollar is pretty important also. While a strong dollar is good in terms of attracting capital to U.S. shores, it makes it more difficult for U.S. firms that export goods. One might argue that a “steady” dollar is generally preferable to a very strong or very weak dollar.
Speaking of the trend of the dollar, a lot of things move inversely to the dollar. In fact, one can typically argue that as long as the dollar is strong, certain “assets” will struggle to make major advances. These include – commodities in general, metals specifically, foreign currencies (obviously) and international bonds (strongly).
Let’s first take a look at the state of the dollar.
Ticker UUP
For our purposes we will use the ETF ticker UUP ( Invesco DB US Dollar Index Bullish Fund) to track the U.S. Dollar. Figure 1 displays a monthly chart and suggests that UUP just ran into – and reversed at least for now – in a significant zone of resistance.
Which way will things go? It beats me. But I for one will be keeping a close eye on UUP versus the resistance levels highlighted in Figures 1 and 2. So will traders of numerous other securities.
Inverse to the Buck
Figure 4 displays the 4-year weekly correlation for 5 ETFs to ticker UUP (a correlation of 1000 means they trade exactly the same a UUP and a correlation of -1000 means they trade exactly inversely to UUP).
In the following charts, note the inverse relationship between the dollar (UUP on the bottom) and the security in the top chart. When the dollar goes way down they tend to go way up – and vice versa.
Note also that in the last year several of these securities went up at the same time the dollar did. This is a historical anomaly and should not be expected to continue indefinitely.
Figure 8 – Ticker BWX (SPDR Bloomberg Barclays International Treasury Bond) vs. UUP (Courtesy AIQ TradingExpert )
Figure 9 – Ticker IBND (SPDR Bloomberg Barclays International Corporate Bond) vs. UUP (Courtesy AIQ TradingExpert )
Figure 10 – Ticker FXE (Invesco CurrencyShares Euro Currency Trust) vs UUP (Courtesy AIQ TradingExpert )
Summary
If the dollar fails to break out of it’s recent resistance area and actually begins to decline then commodities, currencies, metals and international stocks and bonds will gain a favorable headwind. How it all actually plays out, however, remains to be seen.
So keep an eye on the buck. Alot is riding on it – whichever way it goes.
Jay Kaeppel
Disclaimer: The data presented herein were obtained from various third-party sources. While I believe the data to be reliable, no representation is made as to, and no responsibility, warranty or liability is accepted for the accuracy or completeness of such information. The information, opinions and ideas expressed herein are for informational and educational purposes only and do not constitute and should not be construed as investment advice, an advertisement or offering of investment advisory services, or an offer to sell or a solicitation to buy any security.
Technology is what it’s all about these days. Technology (primarily) runs on semiconductors. If the semiconductor business is good, business is good. OK, that’s about as large a degree of oversimplification as I can manage. But while it may be overstated, there is definitely a certain amount of truth to it.
So, it can pay to keep an eye on the semiconductor sector. The simplest way to do that is to follow ticker SMH. Keeping with the mode of oversimplifying things, in a nutshell, if SMH is not acting terribly that’s typically a good thing. So where do all things SMH stand now? Let’s take a look.
Ticker SMH
As with all things market-related (among other things), beauty is in the eye of the beholder. A quick glance at Figure 1 argues that SMH is inarguably in a strong uptrend, well above its 200-day moving average
A glance at Figure 2 suggests that SMH has just completed 5 waves up and may be due for a decline.
Figure 2 – SMH with potentially bearish Elliott Wave count (Courtesy ProfitSource by HUBB)
And Figure 3 highlights a very obvious bearish divergence between SMH weekly price action and the 3-period RSI indicator – i.e., SMH keeps moving incrementally higher while RSI3 reaches slightly lower highs each time. Speaking anecdotally, this setup seems to presage at least a short-term decline maybe 70% of the time. Of course, the degree of decline varies also.
So, what does it all mean? First off, I am not going to make any predictions (if you knew my record on “predictions” you would thing that that is a good thing). I am simply going to point out that one way or the other SMH may be about to give us some important information.
Scenario 1 – SMH breaks out to the upside and stays there: If SMH breaks through the upside and runs, the odds are very high that the overall stock market will run with it.
Course of action: Play for a bullish run by the overall market into the end of the year.
Scenario 2 -SMH breaks out briefly to the upside but then falls back below the recent highs: This would be at least a short-term bearish sign. Failed breakouts are typically a bad sign and the security in question often behaves badly after disappointing bullish investors. In this case, if it happens to SMH it could follow through to the overall market.
Course of action: If this happens, you might consider “playing some defense” (hedging, raising some cash, etc.) . Failed breakouts often make the market a little “cranky” (and cranky is one of my fields of expertise).
Scenario 3: SMH fails to breakout and suffers an intermediate-term decline. If I were to fixate only on the bearish RSI3 divergence I showed earlier in Figure 3, this would seem like the most likely result.
Course of action: If SMH sells off without breaking above recent resistance, keep an eye on SMH price via its 200-day moving average. Simple interpretation goes like this: If SMH sells off but holds or regains it’s 200-day moving average then the bullish case can quickly be re-established; If SMH sells off and holds below its 200-day moving average, that should be considered a bearish sign for the overall market.
Jay Kaeppel
Disclaimer: The data presented herein were obtained from various third-party sources. While I believe the data to be reliable, no representation is made as to, and no responsibility, warranty or liability is accepted for the accuracy or completeness of such information. The information, opinions and ideas expressed herein are for informational and educational purposes only and do not constitute and should not be construed as investment advice, an advertisement or offering of investment advisory services, or an offer to sell or a solicitation to buy any security.
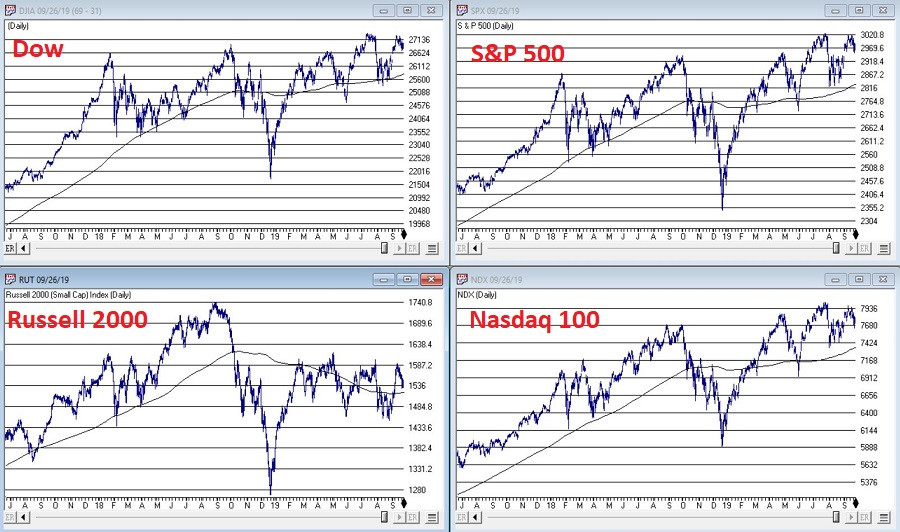
As usual, you can pretty much see whatever you want to see in today’s stock market. Consider the major indexes in Figure 1, displayed along with their respective 200-day moving averages.
If you “want to” be bullish, you can focus on the fact that all 4 of these major indexes are presently above their respective 200-day moving averages. This essentially defines an “uptrend”; hence you can make a bullish argument.
If you want to be “bearish”, you can focus on the “choppy” nature of the market’s performance and the fact that very little headway has been made since the highs in early 2018. This “looks like” a classic “topping pattern” (i.e., a lot of “churning”), hence you can make a bearish argument.
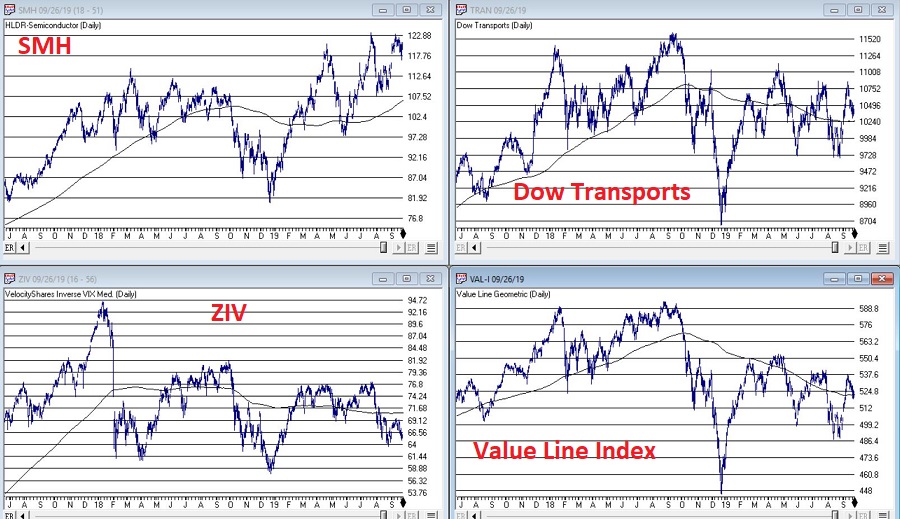
To add more intrigue, consider the 4 “market bellwethers” displayed in Figure 2.
(NOTE: Previously I had Sotheby’s Holdings – ticker BID – as one my bellwethers. As they are being bought out, I have replaced it with the Value Line Arithmetic Index, which has a history of topping and bottoming prior to the major indexes)
The action here is much more mixed and muddled.
*SMH – for any “early warning” sign keep a close eye on the semiconductors. If they breakout to a new high they could lead the overall market higher. If they breakdown from a double top the market will likely be spooked.
*TRAN – The Dow Transports topped out over a year ago and have been flopping around aimlessly in a narrowing range. Not exactly a bullish sign, but deemed OK as long as price holds above the 200-day moving average.
*ZIV – Inverse VIX is presently below it’s 200-day moving average, so this one qualifies as “bearish” at the moment.
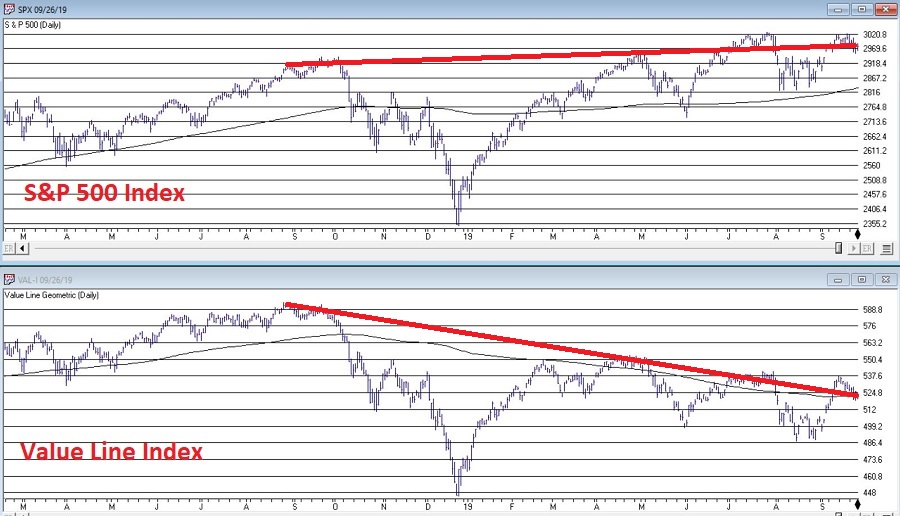
*VAL-I – The Value Line Index is comprised of 1,675 stocks and gives each stock equal weight, so is a good measure of the “overall” market. It presently sits right at its 200-day moving average, however – as you can see in Figure 3 – it is presently telling a different story than the S&P 500 Index.
Figure 3 – S&P 500 trending slightly higher, Value Line unweighted index trending lower (Courtesy AIQ TradingExpert)
The Bottom Line
OK, now here is where a skilled market analyst would launch into an argument regarding which side will actually “win”, accompanied by roughly 5 to 50 “compelling charts” that “clearly show” why the analysts’ said opinion was sure to work out correctly. Alas, there is no one here like that.
If the question is, “will the stock market break out to the upside and run to sharply higher new highs or will it break down without breaking out to new highs?”, I sadly must default to my standard answer of, “It beats me.”
Here is what I can tell you though. Instead of relying on “somebody’s opinion or prediction” a much better bet is to formulate and follow an investment plan that spells out:
*What you will (and will not) invest in?
*How much capital you will allocate to each position?
*How much risk you are willing to take with each position?
*What will cause you to exit with a profit?
*What will cause you to exit with a loss?
*Will you have some overarching “trigger” to cause you to reduce overall exposure?
*And so on and so forth
If you have specific answers for the questions above (you DO have specific answers, don’t you?) then the correct thing to do is to go ahead and follow your plan and ignore the myriad prognostications that attempt to sway you one way or the other.
Jay Kaeppel
Disclaimer: The data presented herein were obtained from various third-party sources. While I believe the data to be reliable, no representation is made as to, and no responsibility, warranty or liability is accepted for the accuracy or completeness of such information. The information, opinions and ideas expressed herein are for informational and educational purposes only and do not constitute and should not be construed as investment advice, an advertisement or offering of investment advisory services, or an offer to sell or a solicitation to buy any security.
Suddenly everyone is once again singing the praises of long-term treasuries. And on the face of it, why not? With interest rates seemingly headed to negative whatever, a pure play on interest rates (with “no credit risk” – which I still find ironic since t-bonds are issued by essentially the most heavily indebted entity in history – the U.S. government) stands to perform pretty darn well.
EDITORS NOTE: We combined Jay's 2 articles on Beating the Bond Market into one article. Later in the article Jay uses AIQ TradingExpert Matchmaker tool to reveal that convertible bonds and high yield corporates have a much higher correlation to the stock market than they do to the long-term treasury.
But is it really the best play?
Long-Term Treasuries vs. “Others”
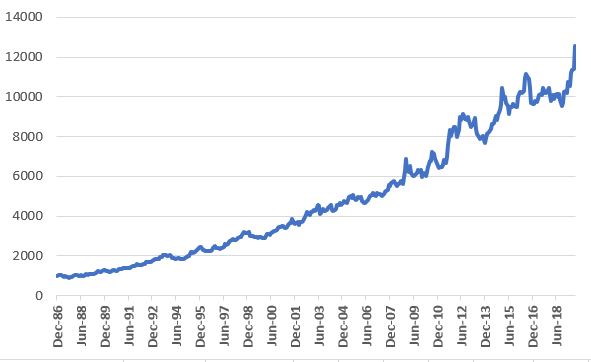
Because a later test will use the Bloomberg Barclays Convertible Bond Index, and because that index starts in 1986 and because I want to compare “apples” to “apples”, Figure 1 displays the growth of $1,000 since 1986 using monthly total return data for the Bloomberg Barclays Treasury Long Index.
Figure 1 – Growth of $1,000 in Long-Term Treasuries (1987-2019)
For the record:
Ave. 12 mo %
+8.2%
Std. Deviation
+9.0%
Max Drawdown
(-15.9%)
$1,000 becomes
$12,583
Figure 2 – Bloomberg Barclays Treasury Long Index (Jan 1987-Jul 2019)
Not bad, apparently – if your focus is return and you don’t mind some volatility and you have no fear of interest rates ever rising again.
A Broader Approach
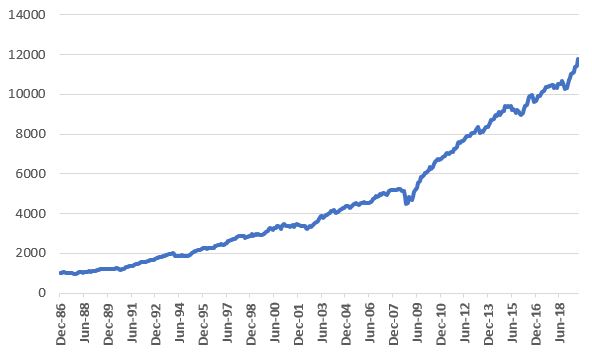
Now let’s consider an approach that puts 25% into the four bond indexes below and rebalances every Jan. 1:
*Bloomberg Barclay’s Convertible Bond Index
*Bloomberg Barclays High Yield Very Liquid Index
*Bloomberg Barclays Treasury Long Index
*Bloomberg Barclay’s Intermediate Index
Figure 3 displays the growth of this “index” versus buying and holding long-term treasuries.
Figure 3 – Growth of $1,000 invested in 4-Bond Indexes and rebalanced annually; 1987-2019
Ave. 12 mo %
+8.0%
Std. Deviation
+6.8%
Max Drawdown
(-14.8%)
$1,000 becomes
$11,774
Figure 4 – 4-Bond Index Results; 1987-2019
As you can see, the 4-index approach:
*Is less volatile in nature (6.8% standard deviation versus 9.0% for long bonds)
*Had a slightly lower maximum drawdown
*And has generated almost as much gain as long-term treasuries alone (it actually had a slight lead over long-term treasuries prior to the rare +10% spurt in long treasuries in August 2019)
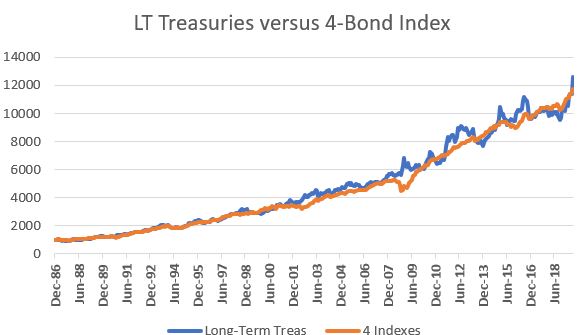
To get a better sense of the comparison, Figure 5 overlays Figures 1 and 3.
Figure 5 – Long Treasuries vs. 4-Bond Index
As you can see in Figure 5, in light of a long-term bull market for bonds, at times long-term treasuries have led and at other times they have trailed our 4-Bond Index. After the huge August 2019 spike for long-term treasuries, they are back in the lead. But for now, the point is that the 4-Bond Index performs roughly as well with a great deal less volatility.
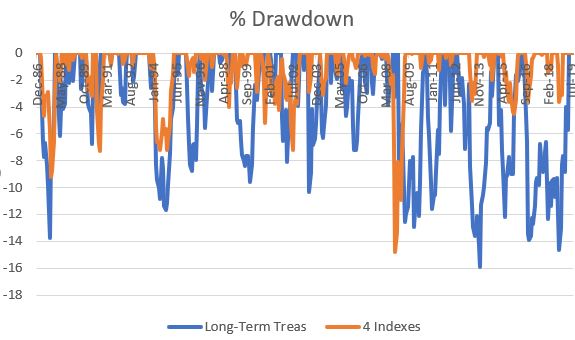
To emphasize this (in a possibly slightly confusing kind of way), Figure 6 shows the drawdowns for long treasuries in blue and drawdowns for the 4-Bond Index in orange. While the orange line did have one severe “spike” down (during the financial panic of 2008), clearly when trouble hits the bond market, long-term treasuries tend to decline more than the 4-Bond Index.
Figure 6 – % Drawdowns for Long-term treasuries (blue) versus 4-Bond Index (orange); 1987-2019
Summary
Long-term treasuries are the “purest interest rate play” available. If rates fall then long-term treasuries will typically outperform most other types of bonds. On the flip side, if interest rates rise long-term treasuries will typically underperform most other types of bonds.
Is this 4-index approach the “be all, end all” of bond investing? Is it even superior to the simpler approach of just holding long-term bonds?
Not necessarily. But there appears to be a better way to use these four indexes – which I will get to below
So, all-in-all the 4-bond index seems like a “nice alternative” to holding long-term treasuries. But the title of these articles says “Beating the Bond Market” and not “Interesting Alternatives that do Just about as Well as Long-Term Treasuries” (which – let’s face it – would NOT be a very compelling title). So, let’s dig a little deeper. In order to dig a little deeper, we must first “go off on a little tangent.”
Bonds versus Stocks
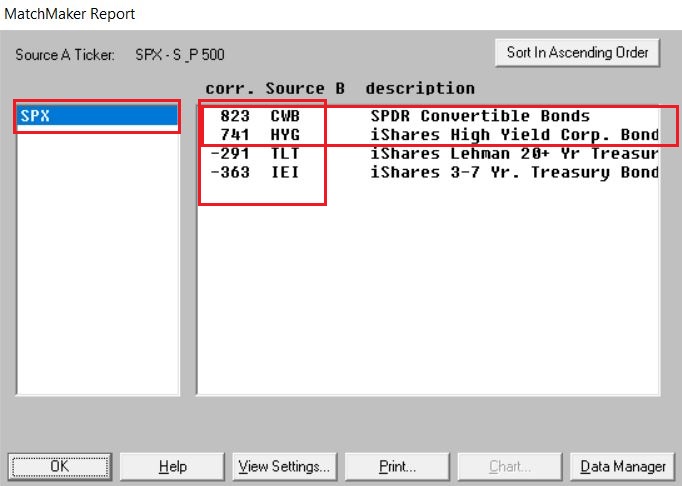
In a nutshell, individual convertible bonds and high yield corporate bonds are tied to the fortunes of the companies that issue them. This also means that as an asset class, their performance is tied to the economy and the business environment in general. If times are tough for corporations it only makes sense that convertible bonds and high yield bonds will also have a tougher time of it. As such it is important to note that convertible bonds and high yield corporates have a much higher correlation to the stock market than they do to the long-term treasury.
In Figures 1 and 2 we use the following ETF tickers:
CWB – as a proxy for convertible bonds
HYG – As a proxy for high-yield corporates
TLT – As a proxy for long-term treasuries
IEI – As a proxy for short-term treasuries
SPX – As a proxy for the overall stock market
BND – As a proxy for the overall bond market
As you can see in Figure 1, convertible bonds (CWB) and high-yield corporates (HYG) have a much higher correlation to the stock market (SPX) than to the bond market (BND).
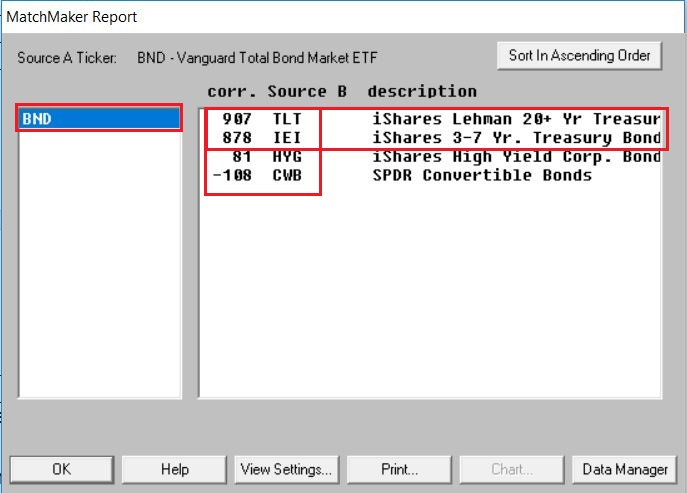
As you can see in Figure 2, long-term treasuries (TLT) and intermediate-term treasuries (IEI) have a much higher correlation to the bond market (BND) than to the stock market (SPX).
Figure 2 – 4-Bond Index Components correlation to Vanguard Total Bond Market ETF (Courtesy AIQ TradingExpert)
A Slight Detour
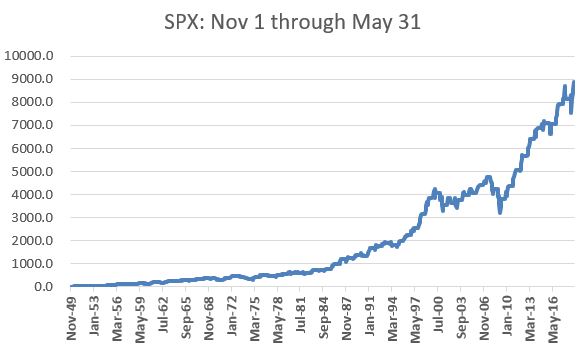
Figure 3 displays the cumulative price change for the S&P 500 Index during the months of November through April starting in 1949 (+8,881%)
Figure 3 – Cumulative % price gain for S&P 500 Index during November through April (+8,881%); 1949-2019
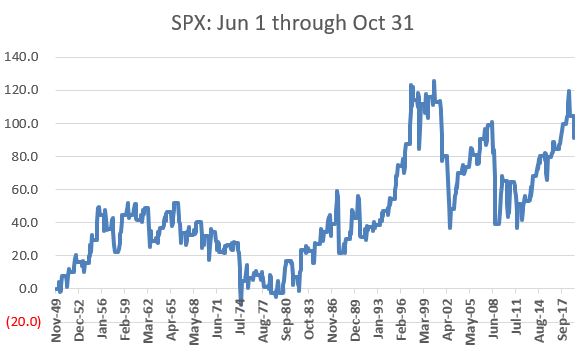
Figure 4 displays the cumulative price change for the S&P 500 Index during the months of June through October starting in 1949 (+91%)
Figure 4 – Cumulative % price gain for S&P 500 Index during June through October (+91%); 1949-2019
The Theory: Parts 1 and 2
Part 1: The stock market performs better during November through April than during May through October
Part 2: Convertible bonds and high-grade corporate bonds are more highly correlated to stocks than long and intermediate-term treasuries
Therefore, we can hypothesize that over time convertible and high-yield bonds will perform better during November through April and that long and intermediate-term treasuries will perform better during May through October.
Jay’s Seasonal Bond System
During the months of November through April we will hold:
*Bloomberg Barclay’s Convertible Bond Index
*Bloomberg Barclays High Yield Very Liquid Index
During the months of May through October we will hold:
*Bloomberg Barclays Treasury Long Index
*Bloomberg Barclay’s Intermediate Index
(NOTE: While this article constitutes a “hypothetical test” and not a trading recommendation, just to cover the bases, an investor could emulate this strategy by holding tickers CWB and HYG (or ticker JNK) November through April and tickers TLT and IEI May through October.)
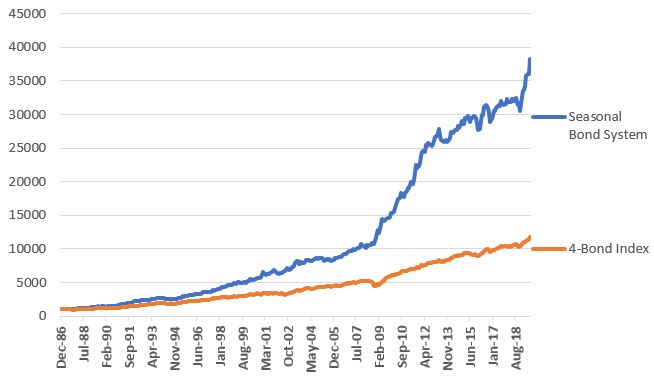
Figure 5 displays the growth of $1,000 invested using this Seasonal System (blue line) versus simply splitting money 25% into each index and then rebalancing on January 1st of each year (orange line).
Figure 5 – Growth of $1,000 invested using Jay’s Seasonal System versus Buying-and-Holding and rebalancing (1986-2019)
Figure 6 displays some comparative performance figures.
Measure
SeasonalSystem
4 Indexes Buy/Hold/Rebalance
Average 12 month % +(-)
+11.9%
+8.0%
Std. Deviation %
8.7%
6.8%
Ave/StdDev
1.37
1.18
Max Drawdown%
(-9.2%)
(-14.8%)
$1,000 becomes
$38,289
$11,774
Figure 6 – Seasonal Strategy versus Buy/Hold/Rebalance
From 12/31/1986 through 8/31/2019 the Seasonal System gained +3,729% versus +1,077% (3.46 times as much) as the buy/hold and rebalance method.
Summary
The Seasonal Bond System has certain unique risks. Most notably if the stock market tanks between November 1 and April 30, this system has no “standard” bond positions to potentially offset some of the stock market related decline that convertible and high yield bonds would likely experience. Likewise, if interest rates rise between April 30 and October 31st, this strategy is almost certain to lose value during that period as it holds only interest-rate sensitive treasuries during that time.
The caveats above aside, the fact remains that over the past 3+ decades this hypothetical portfolio gained almost 3.5 times that of a buy-and-hold approach.
Question: Is this any way to trade the bond market?
Answer: Well, it’s one way….
Jay Kaeppel
Disclaimer: The data presented herein were obtained from various third-party sources. While I believe the data to be reliable, no representation is made as to, and no responsibility, warranty or liability is accepted for the accuracy or completeness of such information. The information, opinions and ideas expressed herein are for informational and educational purposes only and do not constitute and should not be construed as investment advice, an advertisement or offering of investment advisory services, or an offer to sell or a solicitation to buy any security.
The Good News regarding the stock market is that in the long run it goes “Up”. The Bad News is that along the way there are harrowing declines (think -40% or more) as well as long stretches of 0% returns (From Dec-2000 through Sep 2011 the S&P 500 Index registered a total return of -4%. The stock market also went sideways from 1927 to 1949 and from 1965 to 1982).
Large declines and long flat periods can shatter investors financial goals and/or affect an investor’s thinking for years to come. Given the rip-roaring bull market we have seen in the last 10 years it may be wise to reiterate that “trees don’t grow to the sky.” Don’t misunderstood, I am not attempting to “call the top” (as if I could), it’s just that I have been in this business a while and – paraphrasing here – I’ve seen some “stuff.”
What follows is NOT intended to be the “be all, end all” of trading systems. In fact, since 1971 this “system” has beaten the S&P 500 Index by just a fraction. So, one might argue in the end that it is not worth the trouble. But here is the thing to consider: If you would like to earn market returns WITHOUT riding out all of the harrowing declines and the long sideways stretches – it is at least food for thought.
The Monthly LBRMomentum Strategy
There are two indicators involved: a 21-month moving average of the closing price of the S&P 500 Index and a momentum indicator that I call LBRMomentum. The calculations for LBRMomentum appear at the end of the article. LBR is an acronym for Linda Bradford Raschke as it uses a calculation that I first learned about from something written by, well – who else – Linda Bradford Raschke (If you want to learn what the life of a professional trader is all about, I highly recommend you read her book, Trading Sardines).
A Buy Signal occurs:
*When LBRMomentum drops to negative territory then turns higher for one month, AND
*SPX currently or subsequently closes above its own 21-month moving average (in other words, if LBRMomentum rise from below to above 0 while SPX is below it’s 21-month MA, then the buy signal does not occur until SPX closes above its 21-month MA)
*A Buy signal remains in effect for 18 months (if a new buy signal occurs during those 18 months then the 18-month bullish period is extended from the time of the new buy signal)
*After 18-months with no new buy signal sell stocks and move to intermediate-term treasuries until the next buy signal
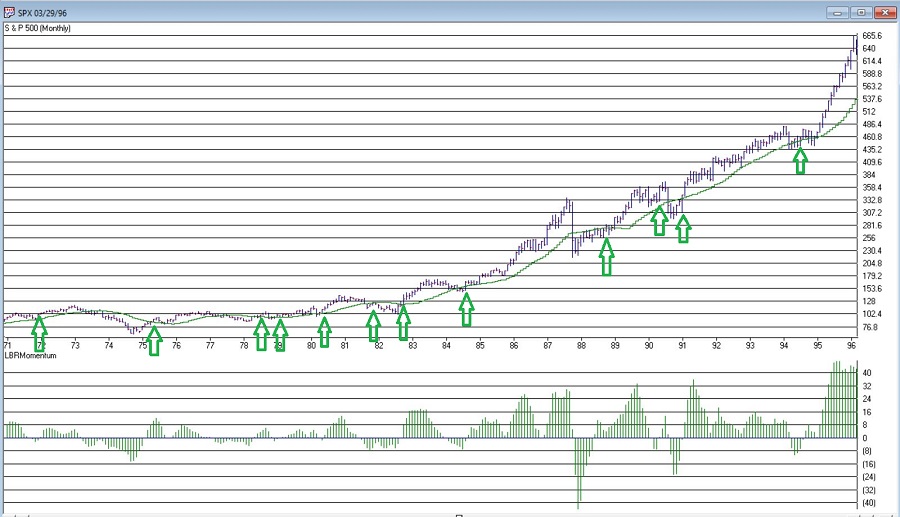
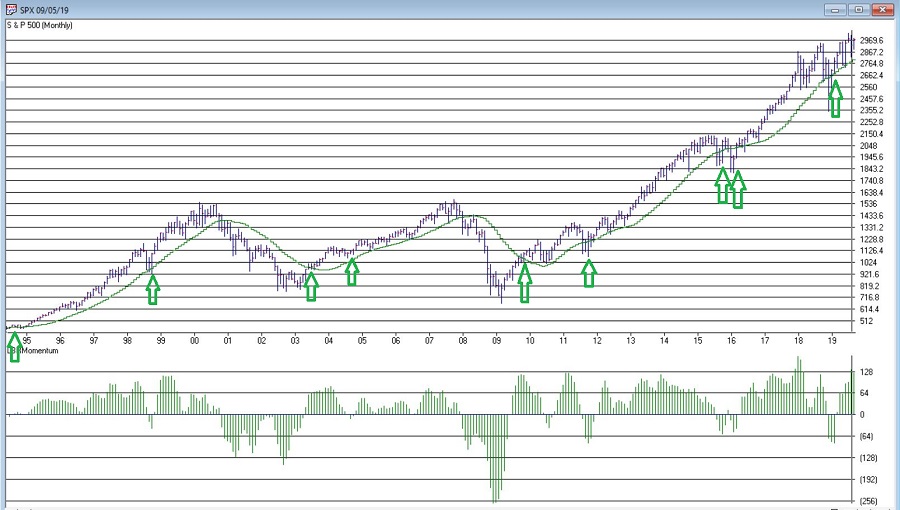
See Figures 1 and 2 for charts with “Buy Signals” displayed
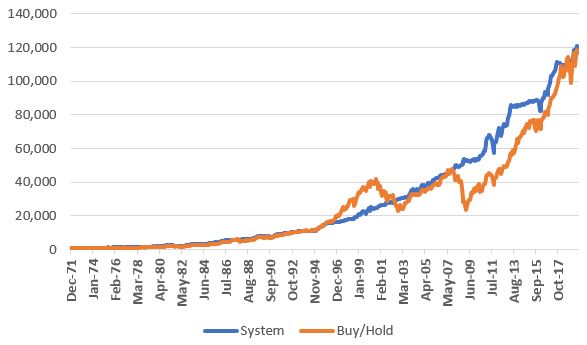
Figure 3 displays the cumulative total return for both the “System” and buying-and-holding SPX. As I mentioned earlier, following the huge bull market of the past 10 years the next results are roughly the same (Strategy = +11,769, buy-and-hold = +11,578%).
Figure 3 – Growth of $1,000 invested using LBRMomentum System (blue line) versus S&P 500 Index buy-and-hold; 1971-2019
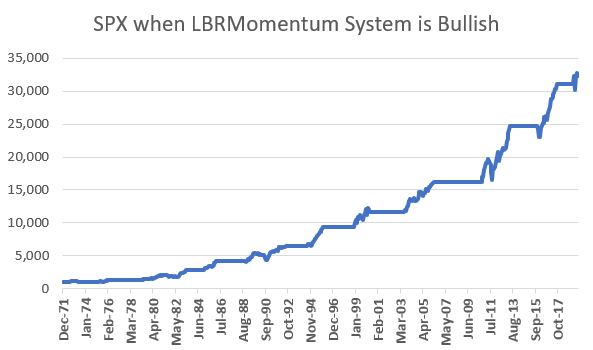
But to get a sense of the potential “Let’s Get Some Sleep at Night” benefits of the System, Figure 4 displays the growth of $1,000 invested in the S&P 500 ONLY when the System is bullish.
Figure 4 – Growth of $1,000 invested in SPX ONLY while LBRMometnum System is Bullish
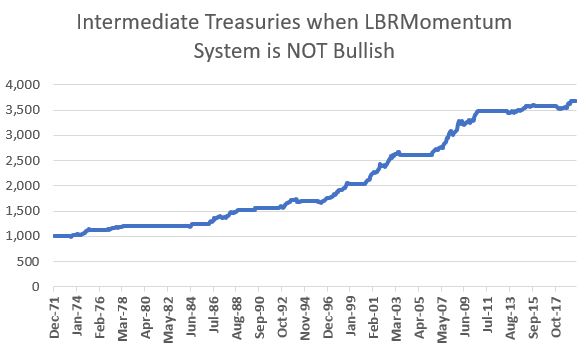
Figure 5 displays the growth of $1,000 invested in the Bloomberg Barclays Treasury Intermediate Index ONLY when the LBRMomentum System is NOT bullish.
Figure 5 – Growth of $1,000 invested in SPX ONLY while LBRMometnum System is NOT Bullish
The things to notice about Figures 4 and 5 are:
a) the lack of significant drawdowns and,
b) the lack of long periods with no net gain.
In other words, this approach represents the Tortoise and not the Hare. The intent is not so much to “Beaten the Market” but rather to avoid being “Beaten Up by the Market.”
Figure 6 displays some relevant comparative performance figures.
Measure
System
Buy/Hold
CAGR %
10.06%
10.03%
Std. Deviation%
10.2%
16.7%
CAGR/StdDev
0.98
0.60
Worst 12 mo. %
(-15.5%)
(-43.3%)
Maximum Drawdown %
(-17.6%)
(-50.9%)
% 12-month periods UP
93%
80%
% 5-Yr. periods UP
100%
89%
Figure 6 – Performance Figures
Note that the Compounded Annual Growth Rate is virtually the same. However, the System clearly experienced a great deal less volatility along the way with a significantly lower standard deviation as well as far lower drawdowns (-17.6% for the System versus -50.9% for buy-and-hold). Note also that the System showed a 12-month gain 93% of the time versus 80% of the time for buy-and-hold. The System also showed a gain 100% of the time over 5-year periods (versus 89% of the time for buy-and-hold).
The last “Buy Signal” occurred on 3/31/2019 and will remain in effect until 9/30/2020.
For the record, this “System” has significantly underperformed buy-and-hold over the past 10 years. Still, if earning a market return over the long-term – without worrying as much about massive declines and long, flat stretches is appealing – it is food for thought.
LBR Momentum
LBRMomentum simply subtracts the 10-period moving average from the 3-month moving average as shown in the code below
LBRMomentum is simpleavg([close], 3) – simpleavg([close], 10).
Jay Kaeppel
Disclaimer: The data presented herein were obtained from various third-party sources. While I believe the data to be reliable, no representation is made as to, and no responsibility, warranty or liability is accepted for the accuracy or completeness of such information. The information, opinions and ideas expressed herein are for informational and educational purposes only and do not constitute and should not be construed as investment advice, an advertisement or offering of investment advisory services, or an offer to sell or a solicitation to buy any security.