However, like all technical indicators there are a number of advantages and disadvantages that any trader should know before incorporating it into their strategy.
Disadvantages
The main disadvantage of the MACD indicator is that it is subjective to the user. Like many technical indicators , the MACD has settings that can be changed to give almost limitless numbers of variations which means results will always differ from person to person. A trader must decide for example what moving averages to choose. The suggested settings are the 12 day moving average, 26 day and 9, however, these can easily be changed. Secondly, a trader must know what timeframe the MACD works best on and there are no easy answers, since the MACD will tend to work differently across different markets. Generally, however, the MACD works best when it is confirmed across several different timeframes – especially further out timeframes such as the weekly chart.
Lagging indicator
Unless using the momentum divergence strategy which seeks to pick tops and bottoms before they occur, the MACD has an inherent disadvantage that occurs with all technical indicators that concern price history such as moving averages. Since moving averages are lagging indicators, in that they measure the change in a stock price over a period of time (in the past), they tend to be late at giving signals. Often, when a fast moving average crosses over a slower one, the market will have already turned upwards some days ago. When the MACD crossover finally gives a buy signal, it will have already missed some of the gains, and in the worst case scenario it will get whipsawed when the market turns back the other way. The best way to get around this problem is to use longer term charts such as hourly or daily charts (since these tend to have fewer whipsaws). It is also a good idea to use other indicators or timeframes to confirm the signals.
Early signals
While the crossover strategy has the limitation of being a lagging indicator, the momentum divergence strategy has the opposite problem. Namely, it can signal a reversal too early causing the trader to have a number of small losing traders before hitting the big one. The problem arises since a converging or diverging trend does not always lead to a reversal. Indeed, often a market will converge for just a bar or two catching its breath before it picks up momentum again and continues its trend.
The solution to such limitations, once more, is to combine it with other indicators and use different confirmation techniques. The ultimate test is to set the MACD up in code and test the indicator yourself on historical data. That way you are able to find out when and in which situations and conditions the indicator works best.
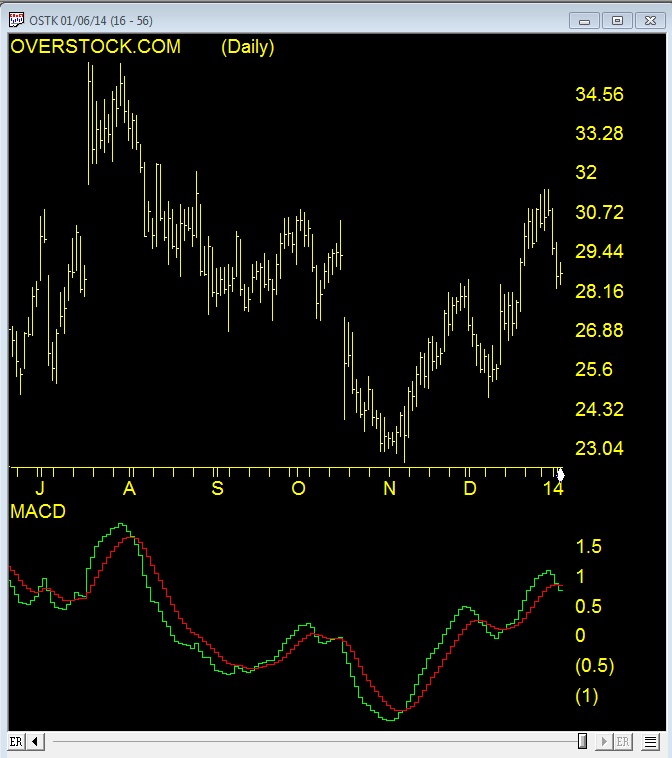
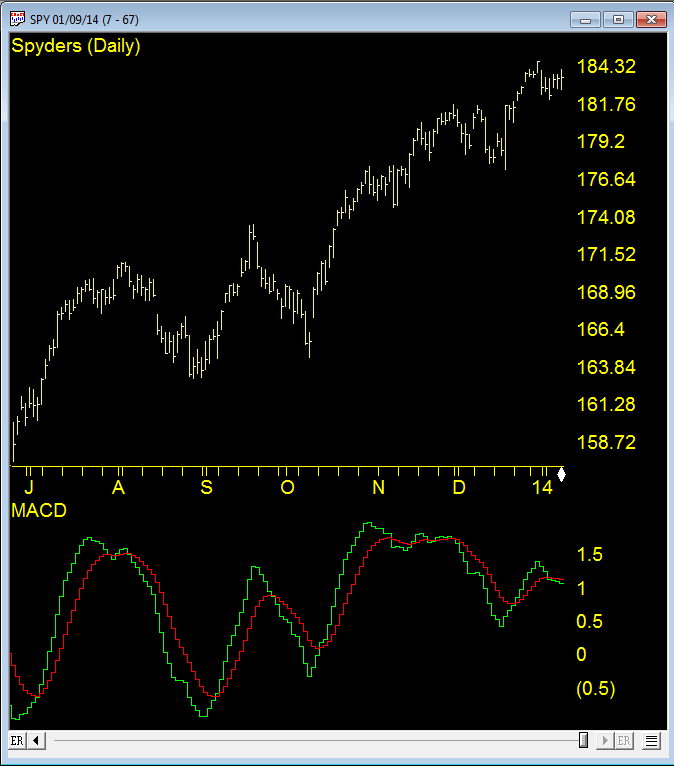
The MACD is one of over 100 indicators available in WinWay TradingExpert Pro, Darren Winter’s preferred trading software