All posts by admin

AIQ Expert Ratings How Best to Use Them

Date & Time July 24, 2023 05:00 PM Eastern

An hour-long session with Steve Hill, CEO of AIQ Systems. It’s one of the longest-running AI-based systems in the world. Like any AI it isn’t perfect. In this session, Steve will cover leveraging these ratings for effective trading decisions.

As every investor knows, in stock market trading, timing is everything. AIQ is the world leader in producing artificial intelligence-based expert systems for stock market timing for use on personal computers.

Briefly, an expert system is a decision-making system that contains the knowledge of experts on a particular subject, and uses this knowledge to make decisions and solve problems. To create an expert system, a knowledge engineer researches experts in a particular field and distills their knowledge and insight into a series of rules. By following the rules, the expert system can analyze a problem and solve it.

AIQ TradingExpert Pro is programmed with the knowledge and insight of respected technical analysts, experts who have developed technical analysis indicators and systems for the last 50 years. The up/down timing signals issued by TradingExpert Pro are based on this knowledge. Since TradingExpert Pro’s timing signals are generated on a scientific basis, free of bias or emotion, you get a disciplined, objective approach to stock market timing.

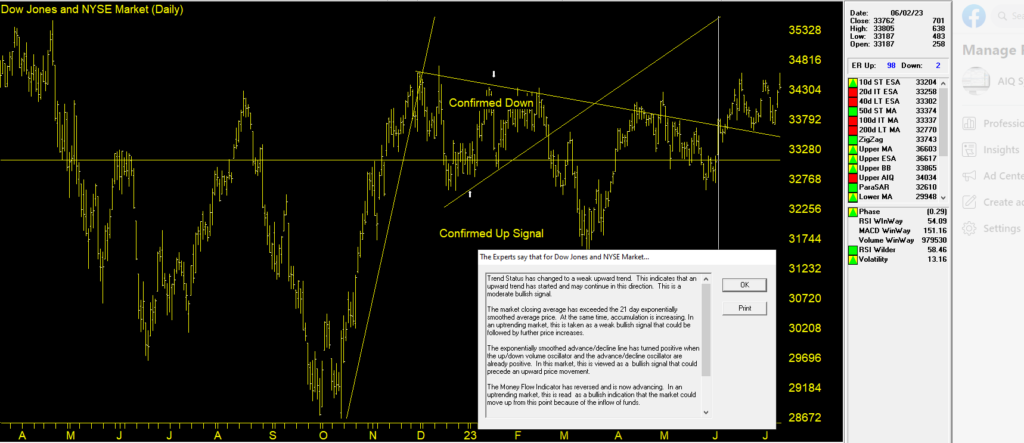
The timing signals produced by the AIQ expert system are in the form of Expert Ratings Behind each Expert Rating is a set of rules that combine the sound principles of technical analysis with the experience of market professionals. Since no single technical indicator works all the time, using indicators in combination increases their reliability. For example, a rule is developed that combines the readings of two or more indicators. This rule is then more reliable than the reading of a single indicator.

Within TradingExpert Pro are two knowledge bases, one specifically designed to issue market timing signals and the other designed to issue stock timing signals. Each TradingExpert Pro knowledge base contains approximately 400 rules, but only a few “fire” on any given day. In the language of expert systems, those rules that are found to be valid on a particular day are described as having “fired”.

Rules can fire in opposite directions. When this happens, the bullish and bearish rules fight it out. It’s only when bullish rules dominate that the Expert Rating signal is bullish, or when bearish rules dominate that the Expert Rating signal is bearish.
The Stochastic Distance Oscillator

The importable AIQ EDS file based on Vitali Apirine’s article in the June issue of Stocks & Commodities, “The Stochastic Distance Oscillator,” can be obtained on request via email to info@TradersEdgeSystems.com.

Vitali’s new variation on the classic stochastic oscillator, is based on price maxima and minima over a range of days. It indicates overbought and oversold levels and helps to identify bull and bear trend changes.

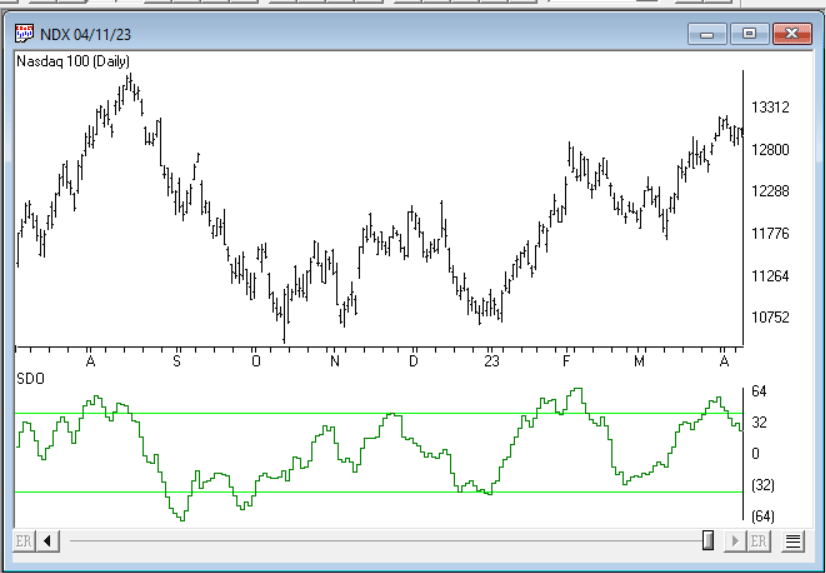
Code for the author’s indicator is set up in the AIQ EDS code file. The code is also shown below. Figure 11 shows a chart of the NASDAQ 100 index (NDX) with the SDO[200,12,3] indicator (green jagged line).

!The Stochastic Distance Oscillator
!Author: Vitali Apirine, TASC June 2023
!Coded by: Richard Denning, 4/15/2023

LBPeriod is 200.
Period is 12.
Pds is 3.
C is [close].
Dist is abs(C-valresult(C,period)).
D is (Dist - lowresult(Dist,LBPeriod))/
       (highresult(Dist,LBPeriod)-lowresult(Dist,LBPeriod)).
DD is iff(C>valresult(C,Period),D,iff(C<valresult(C,Period),-D,0)).
SDO is expavg(DD,Pds)*100.

FIGURE 11: AIQ. Here, the stochastic distance oscillator (SDO) indicator is shown on a chart of the NASDAQ 100 index (NDX). The SDO[200,12,3] indicator is the green jagged line.

—Richard Denning
rdencpa@gmail.com
for AIQ Systems

AIQ now offers customized Technical Analysis and Stock Trading Mentoring programs​

AIQ now offers customized Technical Analysis and Stock Trading Mentoring programs​

If you’re looking to take your stock trading skills to new heights, gain a competitive edge, and maximize your profits, then you’ve come to the right place, or if you want a specific topic, we’re here to help you.

Our bespoke program is designed to provide you with the knowledge, tools, and support you need to take your stock trading to the next level.

Unmatched Analysis Tools:

Our proprietary analysis tools give you an unrivaled advantage in the market, empowering you to make informed trading decisions.

Group/Sector Rotation Strategy:

Our program emphasizes group/sector rotation, a powerful strategy that enables you to capitalize on market cycles and optimize your returns.

Customized Trading Systems:

We recognize the importance of individuality in trading, and our program enables you to develop custom trading systems that align with your goals and preferences.

AI-Based Expert System:

Stay ahead of the game with our AI-based expert system, which provides you with market insights and trend predictions.

Comprehensive Mentorship and Support:

We will guide you, offer personalized feedback, and accelerate your trading journey.

LEARN MORE https://aiqeducation.com/aiq-mentoring-program/

Evaluating John Ehlers Moving Average and Scott Cong’s Adaptive Moving Average

If you missed this AIQ Zoom event, don’t worry, the recording is now available from the link at the end of this post. (FYI it expires on May 25th.

In this 60-minute session, Steve Hill, CEO of AIQ Systems evaluated 2 recent Traders Tips from Stocks & Commodities Magazine.

Scott Cong proposes a new adaptive moving average (AMA). It adjusts its parameters automatically according to the volatility of the market, tracking price closely in trending movement, and staying flat in congestion areas. The new AMA is well-suited for swing trading.

John Ehlers reduces noise in the data by using an average of the open and close instead of using only the closing price.

Steve also created the two EDS files for these indicators. Special thanks to Richard Denning for programming these.

These files should be saved to your/wintes32/EDS strategies folder

Scott Cong AMA EDS file is here

Backtest 1 is here

Backtest 2 is here

John Ehlers RSI is here

Backtest 1 is here

Backtest 2 is here

Here’s the recording link

https://us02web.zoom.us/rec/share/34_WteyIi6rbrc84-H_CKOm_gzNbIFMDlqNWuHPtyNJDzU7BxXOEZpj5og_vMdSi.GOL0lU_U6VkM11hW

An Adaptive Moving Average For Swing Trading

The importable AIQ EDS file based on Scott Cong’s article in the May 2023 issue of Stocks & Commodities magazine, “An Adaptive Moving Average For Swing Trading,” can be obtained on request via rdencpa@gmail.com.

In this article, Scott proposes a new adaptive moving average (AMA). It adjusts its parameters automatically according to the volatility of market, tracking price closely in trending movement, and staying flat in congestion areas. The new AMA is well-suited for swing trading.

The code is also available below.

Code for the author’s indicator as shown below is set up in the downloadable AIQ EDS code file.

!ADAPTIVE MOVING AVERAGE FOR SWING TRADING
!Author: Scott Cong, TASC May 2023
!Coded by: Richard Denning, 03/14/2023

!INPUTS:
Len is 20.

!CODING ABREVIATIONS:
H is [high].
L is [low].
C is [close].
C1 is val([close],1).

TR is Max(H-L,max(abs(C1-L),abs(C1-H))).
Effort is sum(TR,Len).
Result is highresult(H,Len) – lowresult(L,Len).
alpha is Result / Effort.
beta is 1 – alpha.

DaysInto is ReportDate() – RuleDate().
Stop if DaysInto > Len*2.
stopAMA is iff(stop,C, AMA).
AMA is alpha * [close] + beta * valresult( stopAMA, 1).
ESA is expavg(C,Len).

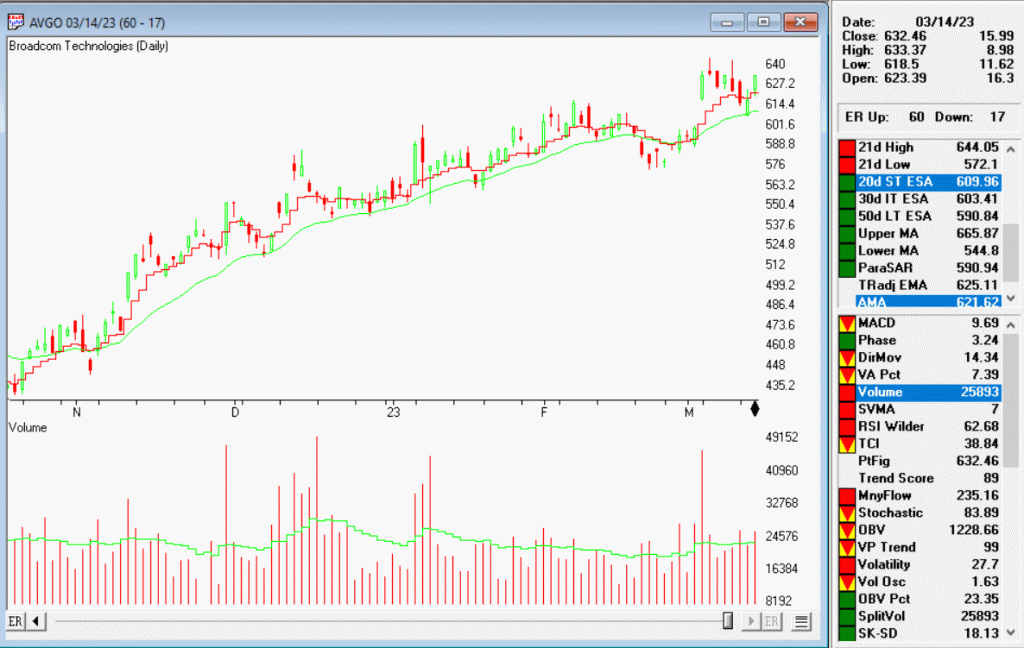
The figure below shows a chart of Broadcom (AVGO) along with the AMA[20] indicator (the red jagged line) and an exponential moving average indicator [20] (the green smooth line).

Richard Denning
rdencpa@gmail.com
for AIQ Systems