The importable AIQ EDS file based on Vitali Apirine’s article in the February 2022 issue of Stocks & Commodities titled “Relative Strength Volume-Adjusted Exponential Moving Average” can be obtained on request via email to info@TradersEdgeSystems.com.
Synopsis: You can use calculations of the relative strength of price, volume, and volatility to filter price movement and help define turning points. In part 2, we explore the relative strength volume-adjusted exponential moving average.
The code is also available here:
! Relative Strength Volume Adjusted Exponential Moving Average
 ! Author: Vitali Apirine, TASC October 2022
 ! Coded by: Richard Denning, 8/16/2022
 Periods is 40.
 Pds is 40.
 Mltp is 10.
 C is [close].
 v IS [volume].
 Mltp1 is 2/(Periods+1).
 Vup is iff(C>valresult(C,1),V,0).
 Vdwn is iff(CMltp. Rate is Mltp1(1+RS1). HD if hasdatafor(Periods2+1) > Periods2. DaysInto is ReportDate() - RuleDate(). Stop if DaysInto > 50.
 stopesa is iff(stop,C,RS_VA_EMA).
 !myesa is alpha * [close] + beta * valresult( stopesa, 1 ).
 RS_VA_EMA is iff(HD,valresult(stopesa,1)+Rate(C-valresult(stopesa,1)),C).  !If(Cum(1)=Periods2,C,PREV+Rate*(C-PREV)).
 ListValues if 1.
 EMAp is expavg(C,Periods).
Code for the author’s indicator is set up in the AIQ EDS code file. Figure 10 shows a comparison of the EMA(40) versus the RS_VA_EMA on a chart of SPY during three months of 2022.
FIGURE 10: AIQ. Here, the exponential moving average of close over 40 bars (smooth blue line) is compared to the RS_VA_EMA(40,40,10) (jagged red line) on SPY.
The AIQ TradingExpert Pro Market Timing signals are not a perfect system. If they were no doubt the founders of AIQ would have kept it secret and traded the signals themselves.
The signals that give us early waring of a change in direction of the market are proprietary. The 400 rules that are used by the Artificial Intelligence inference engine to determine change of market direction use many of the widely known technical tools.
The rating calculation and the indicators contributing to the ratings have not been changed for many years. A decision was made some years ago to avoid constantly moving the goalposts as the constant optimizing or back fitting erodes the validity of the system.
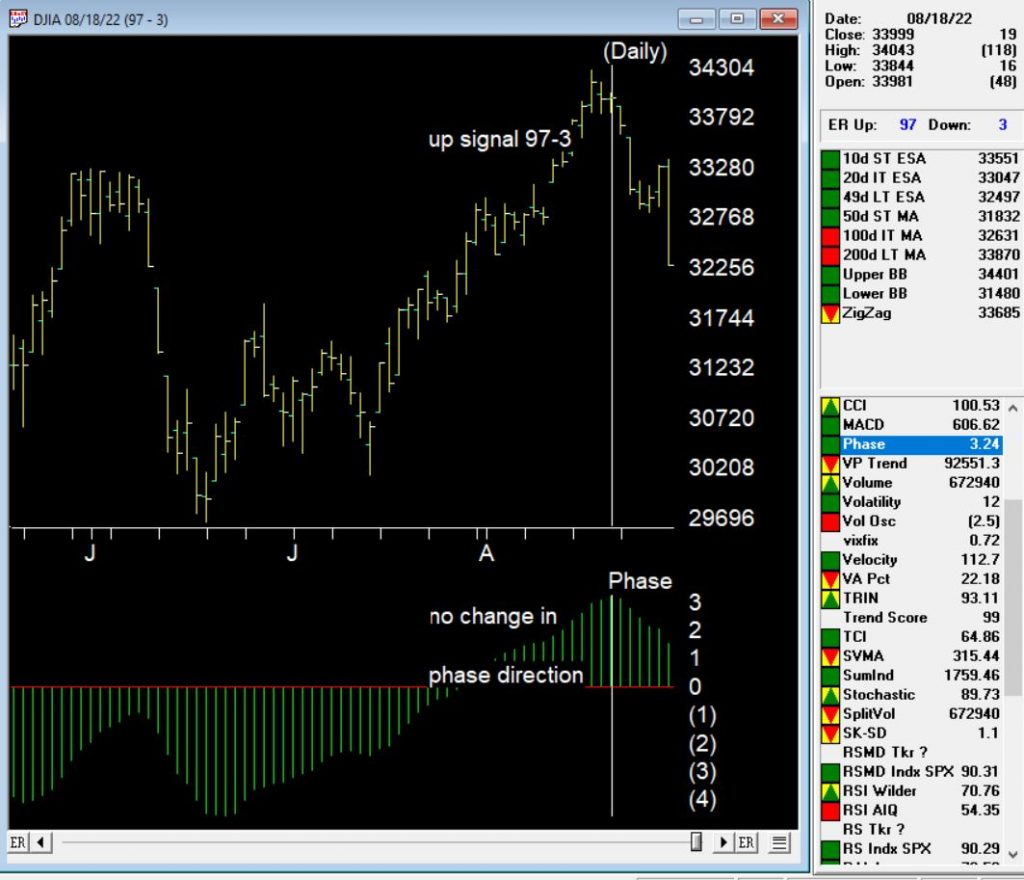
High ratings to the upside or downside of notice have to be 95 or greater (the maximum is 100). the ratings are considered confirmed when the Phase indicator that is outside of the AI system, changes in the direction of the high rating.
So ratings have fired in the last few months how do we confirm them?
We look for the Phase indicator ( a derivative of MACD) to change in the direction of the signal. This needs to occur within a 3 day window before or after the rating.
The last 2 market timing signals illustrate this nicely.
August 18, 2022 97-2 up signal on the market
The up signal occurred during a a 3 day down period on the uptrend, however the Phase indicator did not change direction (it would need to turn up after going down) within the window for confirmation. This signal is therefore unconfirmed by Phase.
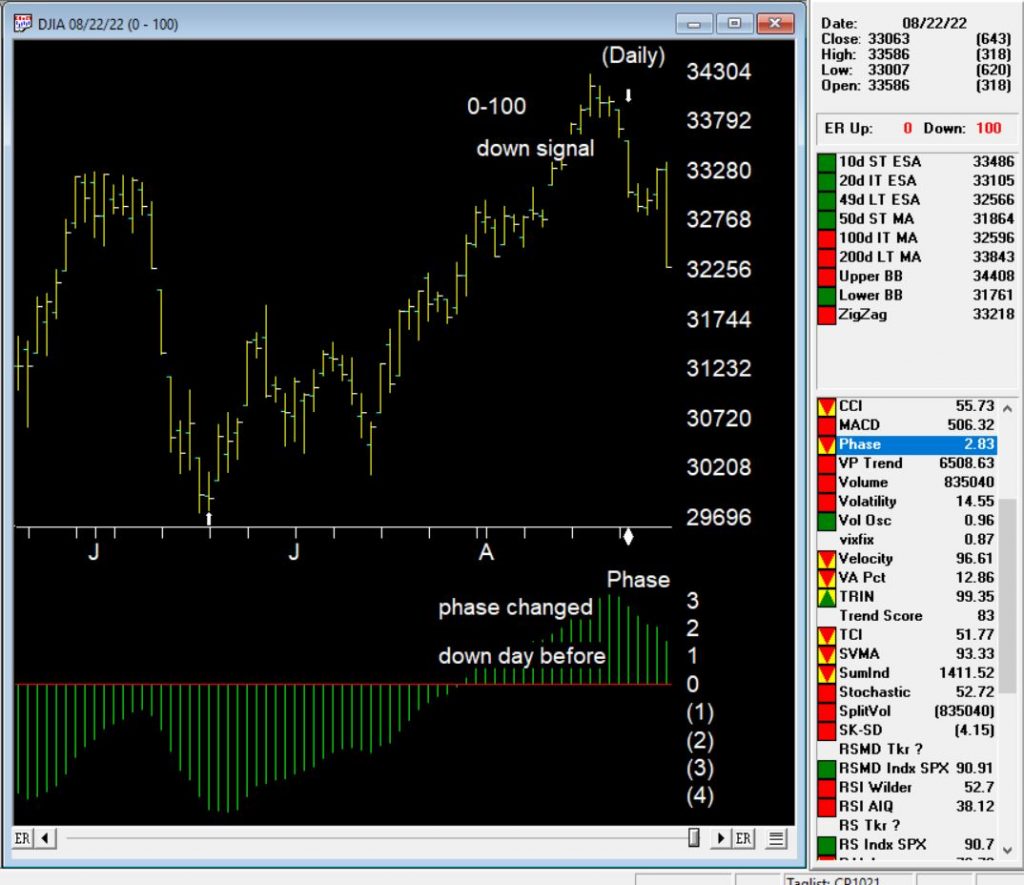
August 22, 2022 down signal on the market
The down signal occurred on 8-22-22. 100 down is the strongest signal the market timing generates. In this case the Phase turned down after a prolonged upward move, on the day before the signal. This is considered a confirmed down signal on the market.
The rules that contributed to 0-100 down on the market
The 100 down signal is the strongest signal the AI system generates. Here are the major technical events that contribute to this rating.
Trend Status has changed to a strong down trend. This indicates that a downward trend has started that may continue in this direction. This is a moderate bearish signal.
The 21 day stochastic has declined below the 80% line and the price phase indicator is decreasing. In this strongly downtrending market this is an indication that the downtrend will continue.
Volume accumulation percentage is decreasing and the 21 day stochastic has moved below the 80% line. In this strongly down market, this is taken as a very strong bearish signal that could be followed by a downward price movement.
The exponentially smoothed advance/decline line has turned negative when the up/down volume oscillator and the advance/decline oscillator are already negative. In this market, this is viewed as a bearish signal that could precede a downward price movement.
The up/down volume oscillator has turned negative when the exponentially smoothed advance/decline line and the advance/decline oscillator are already negative. In this market, this is viewed as a bearish signal that could precede a downward price movement.
The new high/new low indicator has reversed to the downside. This is a reliable bearish signal that is often followed by an downward price movement. In this market a continued strong downtrend can be expected.
The importable AIQ EDS file based on Markos Katsanos’ article in the August 2022 issue of Stocks & Commodities magazine, “Trading The Fear Index” and the “CUM1.csv” file can be obtained on request via email to info@TradersEdgeSystems.com. Code for the author’s system is set up in the AIQ code file.
Synopsis: Here is a long-short strategy to capitalize on stock market volatility using volatility-based exchange-traded funds (ETFs or ETNs)…
! VIX ETF SYSTEM
 ! This should be applied only to long VIX ETF.
 ! VIX ETF DAILY LONG-SHORT TRADING SYSTEM
 ! COPYRIGHT MARKOS KATSANOS 2022
 ! To be applied on a daily chart of long VIX ETFs:
   ! VXX,VIXY,UVXY,VIXM,VXZ,SVOL
 ! INPUTS:
 C is [close].
 H is [high].
 L is [low].
 VIXUPMAX is 50. ! VIX UP% MAX
 VBARS is 6.         ! Number of bars to calculate VIXUP,VIXDN & RC
 STBARSL is 25.   ! Number of bars to calculate slow stochastic
 STBARSS is 10.   ! Number of bars to calculate fast stochastic
 ! COMPARISON INDEX
 VIXC is TickerUDF("VIX",C).
 VIXH is TickerUDF("VIX",H).
 VIXL is TickerUDF("VIX",L).
 SPYC is TickerUDF("SPY",C).
 SPYH is TickerUDF("SPY",H).
 SPYL is TickerUDF("SPY",L).
 ! STOCHASTIC
 STOCHVS is (VIXC-lowresult(VIXL,STBARSS))/(highresult(VIXH, STBARSS)-lowresult(VIXL, STBARSS)+0.0001)100. STVIXS is simpleavg(STOCHVS,3). STOCHSS is (SPYC-lowresult(SPYL,STBARSS))/(highresult(SPYH,STBARSS)-lowresult(SPYL,STBARSS)+0.0001)100.
 STSPYS is simpleavg(STOCHSS,3).
 STOCHVL is (VIXC-lowresult(VIXL,STBARSL))/(highresult(VIXH,STBARSL)-lowresult(VIXL,STBARSL)+0.0001)100. STVIXL is simpleavg(STOCHVL,3). STOCHSL is (SPYC-lowresult(SPYL,STBARSL))/(highresult(SPYH,STBARSL)-lowresult(SPYL,STBARSL)+0.0001)100.
 STSPYL is simpleavg(STOCHSL,3).
 !VIX
 VIXDN is (VIXC/valresult(highresult(VIXC,VBARS),1)-1)100.  VIXUP is (VIXH/valresult(lowresult(VIXL,VBARS),1)-1)100.
 ! CORRELATION TREND
 PeriodToTest is VBARS-1.
   !CUM1 is a custom ticker from DTU import of a CSV file**   !CUM1 file is required for this system to work
      ! PEARSON CORRELATION
 ValIndex is TickerUDF("VIX", [close]).
 ValTkr is TickerUDF("CUM1", [close]).
 SumXSquared is Sum(Power(ValIndex,2), PeriodToTest).
 SumX is Sum(ValIndex, PeriodToTest).
 SumYSquared is Sum(Power(ValTkr,2), PeriodToTest).
 SumY is Sum(ValTkr, PeriodToTest).
 SumXY is Sum(ValTkr*ValIndex, PeriodToTest).
 SP is SumXY - ( (SumX * SumY) / PeriodToTest ).
 SSx is SumXSquared - ( (SumX * SumX) / PeriodToTest ).
 SSy is SumYSquared - ( (SumY * SumY) / PeriodToTest ).
 RC is SP/SQRT(SSx*SSy).
 !LONG
 BR1 if HasDataFor(STBARSL+10)>STBARSL+3.
 BR2 if STVIXL>STSPYL .
 BR3 if STVIXS>STSPYS.
 BR4 if STVIXS>valresult(STVIXS,1).
 BR5 if VIXUP>VIXUPMAX.
 BR6 if RC>0.8.
 BR7 if RC>valresult(RC,1).
 BUY if BR1 and BR2 and BR3 and BR4 and BR5 and BR6 and BR7.
 SR1 is STSPYS>STVIXS.
 SR2 is STVIXS<valresult(STVIXS,1).
 SELL if SR1 or SR2.
 !SHORT
 SS1 if HasDataFor(STBARSS+10)>STBARSS+3.
 SS2 if VIXC<= lowresult(VIXC,3). SS3 if VIXUP15.
 SS6 if STSPYS>STVIXS.
 SS7 if STSPYS>valresult(STSPYS,1).
 SHORT if SS1 and SS2 and SS3 and SS4 and SS5 and SS6 and SS7.
 CR1 if VIXUP>VIXUPMAX.
 CR2 if STVIXS>valresult(STVIXS,1).
 CR3 if RC>0.8.
 COVER if CR1 and CR2 and CR3.
 TEST if 1=1.
Figure 6 shows the CUM1.csv file that must be created in Excel and then imported using the DTU utility to a new index ticker called “CUM1.” The file increments one unit, like an index, for each trading day starting on 10/1/2003 and continues to the current date. This file would have to be updated manually via the data manager function.
FIGURE 6: AIQ SYSTEMS. This shows the portion of the CUM1.csv file that must be created in Excel.
Figure 7 shows a summary EDS backtest of the system using the VXX and VXZ from 6/21/2018 to 6/21/2022.
FIGURE 7: AIQ SYSTEMS. This shows a summary EDS backtest of the system using the VXX and VXZ from 6/21/2018 to 6/21/2022.
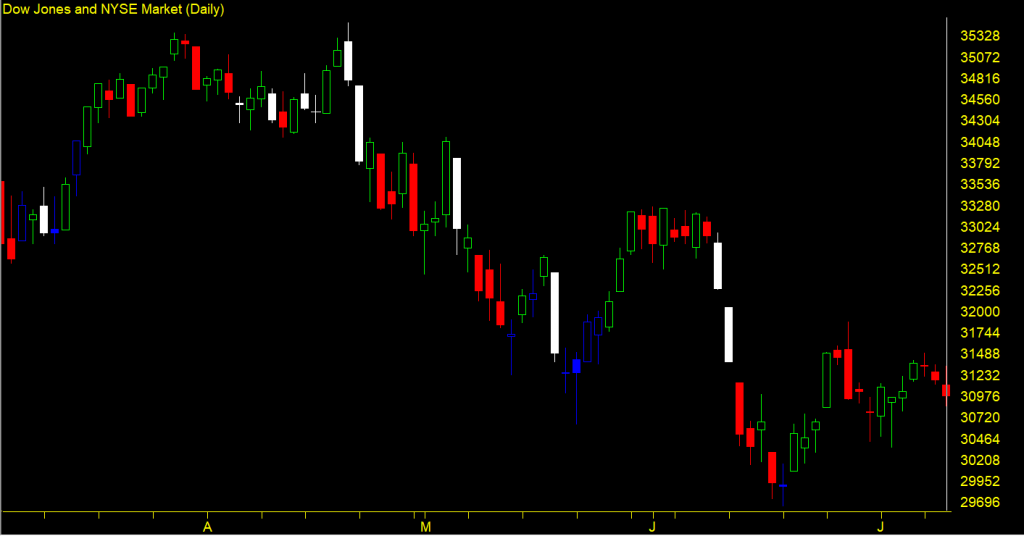
High ER Up and ER Down signals as a color study on DJI
Hour-long recording of session with Steve Hill, CEO of AIQ Systems. We explored some indicator trading strategies and undertook some testing of effectiveness. Wenalso combined them together into one strategy, prior to adding them as a Color Study.
July 20, 2022 05:00 PM Eastern Time (US and Canada)
Topic: Indicator Trading Strategies and Custom Studies Hour-long session with Steve Hill, CEO of AIQ Systems. We’ll explore some indicator trading strategies and we’ll undertake some testing of effectiveness. We’ll also combine them together into one strategy, prior to adding them as a Color Study.