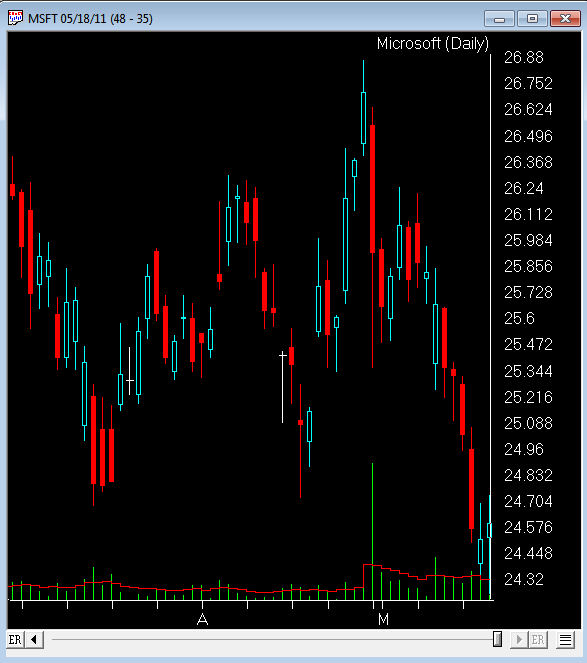
Steve Palmquist.Author of ‘The Timely Trades Letter’. ‘How to Take Money from the Markets’, and Money-Making Candlestick Patterns. When traders get together and discuss trading patterns or setups someone usually asks why a particular pattern works. To explain trading patterns the market is often described as a battle between the Bulls trying to drive prices up, and the Bears trying to drive prices down. The patterns are the result of this contest between the Bulls and Bears. Some traders will start using a pattern or trading system when they hear an explanation of why it works that makes sense to them. We all have a need to understand why something should work. However, for traders it is more important to know how often a pattern works than an explanation of why it works. Knowing why a pattern works is interesting. Knowing how often a trading pattern works can be profitable. Knowing in what specific market conditions a pattern works best can be very profitable.
In addition to knowing how often a particular trading pattern produces profitable trades, traders should understand if there are observable parameters that can strongly influence results. Some of the questions traders should address before using a trading pattern are: How long should a position be held? What are good profit target points? What type of orders should be used? Where should stop loss orders be entered? There are a number of effective tools for the trader’s tool box. However, like any other tool the user needs to understand exactly what it is designed for, and how to use it effectively. Carpenters can make beautiful things with a table saw; however they need to understand how to use it, and also know when another tool might be more appropriate for the task at hand. They also need to know the safety rules, how to avoid kickback, and the importance of using a push tool. At least the carpenters that still have all their fingers do. Some traders gain a better understanding of trading patterns, and the environments in which to use them, though experience. After trading for a number of years they begin to understand what variations of a particular trading pattern work best, and which ones are more prone to failure. Experience often produces good results when we are listening closely, however it can be costly.
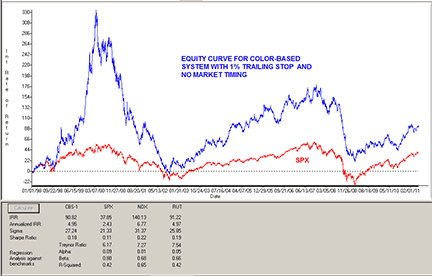
A less expensive way to develop an in depth understanding of how trading patterns work is by backtesting the pattern. Backtesting also allows us to test how simple variations or changes in the trading pattern effect results. Backtesting can be done over a variety of time periods and even in specific market conditions. The more traders understand exactly how and when their trading patterns work, the more effective use they will be able to make of each tool in the trading toolbox. The Timely Trades Letter provides additional information on trading tools and techniques on a weekly basis. The successful trader has a tool box with a variety of trading tools for use in different market conditions. The trader, like the carpenter, must go beyond just acquiring the tools. Traders must understand which tool to use for a specific task, and have a clear understanding of how the tool works, and what can and cannot be done with it. I have extensively tested several trading systems, the results of this testing on specific trading trading tools are outlined in ‘How to Take Money from the Markets’, and Money-Making Candlestick Patterns. The testing process helps us understand how stocks usually behave after forming a specific pattern such as being outside the Bollinger Bands, showing strong distribution or accumulation, or pulling back or retracing during a trend. Understanding what a stock is most likely to do forms the beginning of a trading strategy. Trading without this information is taking unknown risks.
In addition to knowing how often a particular trading pattern produces profitable trades, traders should understand if there are observable parameters that can strongly influence results. Some of the questions traders should address before using a trading pattern are: How long should a position be held? What are good profit target points? What type of orders should be used? Where should stop loss orders be entered? There are a number of effective tools for the trader’s tool box. However, like any other tool the user needs to understand exactly what it is designed for, and how to use it effectively. Carpenters can make beautiful things with a table saw; however they need to understand how to use it, and also know when another tool might be more appropriate for the task at hand. They also need to know the safety rules, how to avoid kickback, and the importance of using a push tool. At least the carpenters that still have all their fingers do. Some traders gain a better understanding of trading patterns, and the environments in which to use them, though experience. After trading for a number of years they begin to understand what variations of a particular trading pattern work best, and which ones are more prone to failure. Experience often produces good results when we are listening closely, however it can be costly.
A less expensive way to develop an in depth understanding of how trading patterns work is by backtesting the pattern. Backtesting also allows us to test how simple variations or changes in the trading pattern effect results. Backtesting can be done over a variety of time periods and even in specific market conditions. The more traders understand exactly how and when their trading patterns work, the more effective use they will be able to make of each tool in the trading toolbox. The Timely Trades Letter provides additional information on trading tools and techniques on a weekly basis. The successful trader has a tool box with a variety of trading tools for use in different market conditions. The trader, like the carpenter, must go beyond just acquiring the tools. Traders must understand which tool to use for a specific task, and have a clear understanding of how the tool works, and what can and cannot be done with it. I have extensively tested several trading systems, the results of this testing on specific trading trading tools are outlined in ‘How to Take Money from the Markets’, and Money-Making Candlestick Patterns. The testing process helps us understand how stocks usually behave after forming a specific pattern such as being outside the Bollinger Bands, showing strong distribution or accumulation, or pulling back or retracing during a trend. Understanding what a stock is most likely to do forms the beginning of a trading strategy. Trading without this information is taking unknown risks.