Here is the Aiq code based on Edgar Kraut’s article in this issue, “A Color-Based System For Short-Term Trading.” The code is also provided at the websites noted below. I coded the color indicators and three systems that use the indicators. Two of the three systems are discussed here.
I ran backtests using the AIQ Portfolio Manager module from 1/1/1998 to 5/13/2011 trading the Nasdaq 100 list of stocks. In Figure 10, I show the test results of simulated trading using the system that was proposed in Kraut’s article for trading the SPY with the following capitalization parameters:
- Maximum positions per day = 3
- Maximum total positions allowed = 10
- Choose candidates using highest volume on the day of the signal
- Size each position at 10% of total account equity recomputed every day
Figure 10: AIQ SYSTEMS, Kraut’s Color-Based System. Here is a sample equity curve for Edgar Kraut’s system trading the NASDAQ 100 list of stocks compared to the S&P 500 index over the test period 1/1/98 to 5/13/11. This original system uses a 1% trailing stop as the only exit.SPX in red.
For the test period, the original system using the 1% trailing stop as the only exit showed an average annual return of 4.95% with a maximum drawdown of 78.52% on 10/9/2002.
Since the drawdown of 78.52% on the original system was more than most traders could tolerate, I added trend and market trend filters and also changed the buy rules and exit rules as follows:
Buy if there is a green or blue bar today and if yesterday there were six consecutive bars of orange or red color and the 200-bar simple moving average of both the stock and the S&P 500 index are higher than they were 10 bars ago.
Exit if there are four consecutive bars of orange or red.
All trades for both systems are executed at the next open after a trade signal occurs. A commission of $0.01 per share round-turn was used. The same capitalization parameters were used in testing both the modified system and the original system.
In Figure 11, I show the test results of simulated trading on the Nasdaq 100 list of stocks using this modified system. For the test period, this modified system showed an average annual return of 20.24% with a maximum drawdown of 31.55% on 5/25/2000.
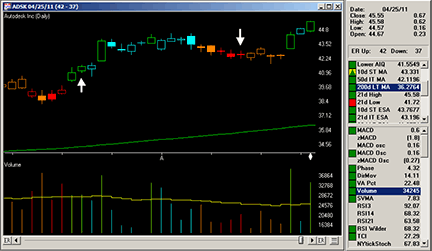
In Figure 12, I show the color-based indicators applied to both the price and volume on a chart of Adsk. The arrows on the chart also show a sample trade from the modified system.
Figure 12: AIQ SYSTEMS, MODIFIED System example. Shown here is a chart of ADSK with color studies and arrows showing sample trades from the modified system.
The code and Eds file can be downloaded from www.TradersEdgeSystems.com/traderstips.htm.
AIQ code:
! A COLOR-BASED SYSTEM FOR SHORT-TERM TRADING
! Author: Edgar Kraut, TASC July 2011
! Coded by: Richard Denning 5/14/11
! www.TradersEdgeSystems.com
! ABBREVIATIONS:
C is [close].
C10 is valresult(C,10).
V is [volume].
V10 is valresult(V,10).
! FOR COLOR BARS:
Green if C > C10 and V > V10.
Blue if C > C10 and V < V10.
Orange if C < C10 and V < V10.
Red if C < C10 and V > V10.
! FOR UDF IN REPORT COLUMN:
Signal is iff(Green,”Green”,iff(Blue,”Blue”,
iff(Orange,”Orange”,iff(Red,”Red”,””)))).
! TRADING SYSTEMS:
! ORIGINAL SYSTEM:
Buy if (Green or Blue) .
! Use built-in trailing stop set to 99 for exits
! FIRST MODIFICATION (NOT USED):
Buy2 if (Green or Blue)
and countof((Red or Orange),6,1)=6.
! SECOND MODIFICATION (FINAL SYSTEM):
SMA is simpleavg(C,200).
SPXsma is TickerUDF(“SPX”,SMA).
Buy3 if (Green or Blue)
and countof((Red or Orange),6,1)=6
and SMA > valresult(SMA,10)
and SPXsma > valresult(SPXsma,10).
Sell2 if countof((Red or Orange),4)=4.
Richard Denning for AIQ Systems
mailto:info@TradersEdgeSystems.com


