We heard you! One of the most common new feature request we’ve received this year is the ability to overlay indicators like MACD and Stocjastics on the price chart. TradingExpert Pro 9.4 upgrade now incorporates this feature.
Overlay indicators on Price Chart
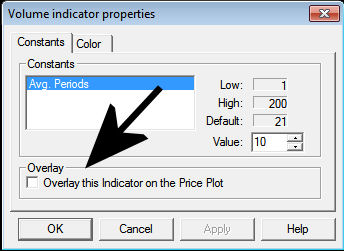
Available only in AIQ Charts (rollout into RTalerts is on a future release). You can now display an indicator like MACD, Volume, Stochastic etc directly to the price chart, both real-time and end of day. Simply bring up a chart, right click on the indicator of your choosing in the Control Panel and select ‘Overlay this indicator on price plot’.
Currently this feature does not allow you to permanently save the seting for all charts and has to be applied individually. Here’s MSFT with 1 minute price bars and the MACD overlaid on the price plot.

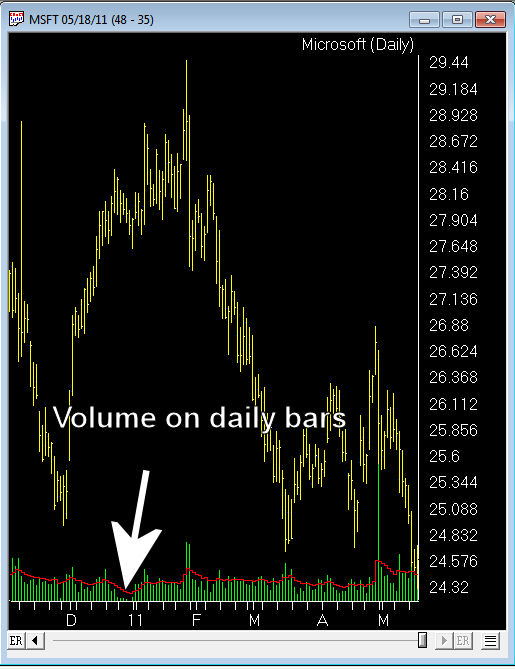
Here’s MSFT daily price bars and Volume overlaid on the price plot.
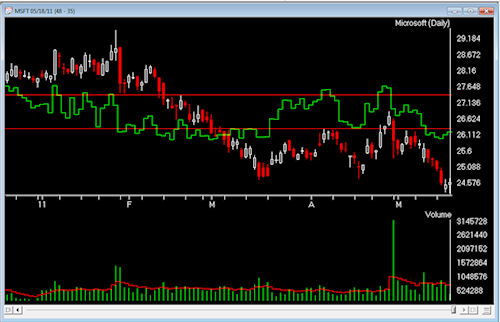
Here’s MSFT Candlestick chart overlaid with Stochastic indicator.
Candlestick color selector
Hollow and solid candles can now be assigned their own colors. Under Chart, Settings, Colors.
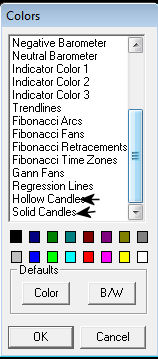
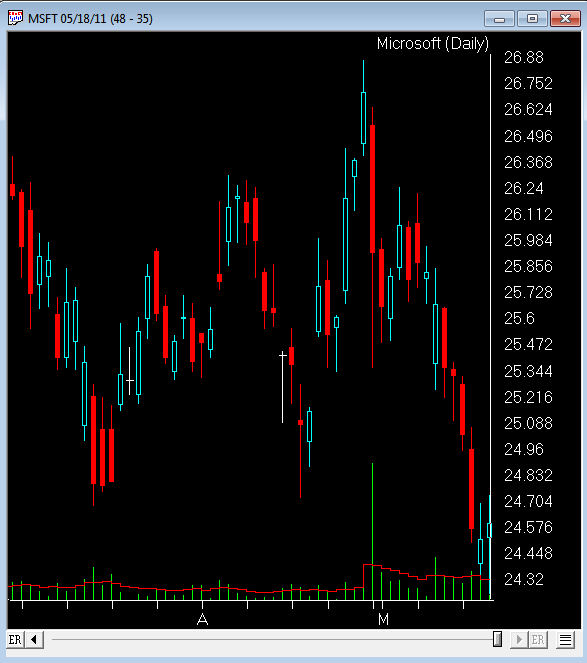
Here’s MSFT with hollow candles in green and solid candles in red.
This upgrade is FREE OF CHARGE for clients of the TradingExpert Pro on the monthly lease plan, all other TradingExpert or TradingExpert Pro clients please contact AIQ at 1-800-332-2999 for details. If you are not on the monthly plan and install the upgrade your key number may be invalidated.
Download now through the AIQ store
registration details are required for this upgrade