I like to think of myself as a creative, independent thinker. Of course I’d also like to think of myself as handsome, charming and witty and look how that’s worked out. But I digress. Anyway, on my Twitter feed last week I posted a link to a piece from Stock Trader’ Almanac regarding a terrific seasonal trend in crude oil. Let’s take a closer look at what the boy’s at the Stock Trader’s Almanac lab uncovered.
The Stock Trader’s Almanac Crude Oil Seasonal Trend
The seasonal trend highlighted in the link to STA points out the fact that crude oil trends to be bullish for 60 trading days starting on February 13th (or the closest trading day to it). As we will see in a moment, the results are compelling. What is even more interesting is to compare the results generated by holding a long position in crude oil (or a crude oil ETF) during this time period to the results generated by holding a long position in crude oil all of the rest of the year.
The Test
For the record, the historical data that I use for crude oil futures is based on a “continuous contract” (which basically strings together the daily price change for the currently most active contract at any given point in time), so they may not exactly reflect what a real trader might have experienced in real-time trading. But they will be close. And the point of this exercise is not really the “raw” returns but the “relative” returns of the “bullish” period versus “all other” periods.
So for our test:
*Bullish Period
Starts at the close of trading on the last trading day prior to February 13th each year, and lasts for 60 trading days.
*Bearish Period
Starts at the end of the 60 day period described above and lasts until the close of trading on the last trading day prior to February 13th the next year.
The Results
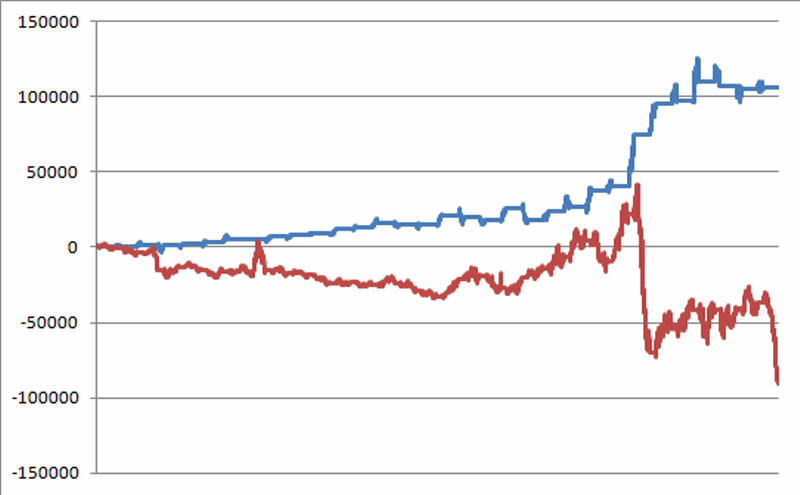
Figure 1 displays the growth of equity achieved by holding a long position in crude oil futures (a $1 move in the price of crude oil equals $1,000 change in the value of the futures contract) during the bullish period (blue line) versus holding a long position in crude oil futures during the bearish period (red line) since April 5th, 1983 (when crude oil futures starting trading).
Figure 1 – $ +(-) for crude during bullish period (blue line) versus bearish period (red line); 4/5/1983 through 1/16/2014
For the record:
-During the “bullish” period crude oil futures gained roughly +$106,000.
-During the “bearish” period crude oil futures lost roughly (-$88,000)
Using ETFs instead of Futures
While the numbers above are compelling, let’s be honest, the vast majority of traders will never trade a crude oil futures contract (and in reality that is probably a good thing given the dollars and risks involved). So what about using an ETF that tracks the price of crude oil?
The most heavily traded crude oil ETF is ticker USO. Now I don’t wish to go into details but USO has had some – how shall I say this, um, performance issues – due to the way its portfolio is configured (i.e., it holds several months of futures contracts however, due to “contango” – whereby the farther out contracts trade at a higher price than the closer months – its share price has tended to lag the price of crude oil, particularly in up markets and, oh never mind. If you want to know more Google “contango and uso”).
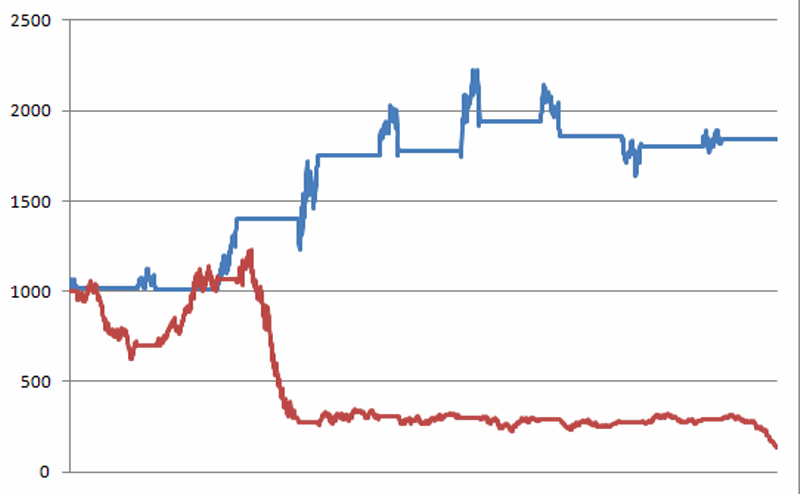
Still, the results generated by this seasonal trend via USO are pretty compelling. Figure 2 displays the growth of $1,000 fully invested in USO only during the bullish seasonal period (blue line) versus $1,000 fully invested in USO only during the bearish seasonal period (red line) since USO started trading on 4/10/2006.
Figure 2 – Growth of $1,000 invested in ETF ticker USO during bullish period (blue line) versus bearish period (red line); 4/10/2006 through 1/16/2014
For the record:
-During the “bullish” period, $1,000 in USO grew to $1,861 (+86.1%)
-During the “bearish” period, $1,000 in USO declined to $146 (-85.4%)
These types of stark contrasts are what we “quantitative analyst types” refer to as “statistically significant.”
Summary
So does it make sense to simply buy and hold crude oil futures during the bullish period and to sell short during the bearish periods? Probably not. For the record I am not advocating this as a standalone strategy. A closer look at Figures 1 and 2 reminds us that large unexpected moves can and will happen regardless of what the “seasonals” are suggesting “should” happen. And as always, there is never any guarantee that the bullish phase will see higher prices nor that the bearish phase will see lower prices.
Probably a better way to use this information is to given the bullish case the benefit of the doubt during the bullish phase and vice versa. To wit, should crude oil show signs of bottoming out and/or attempting to rally starting around mid-February, aggressive traders might do well to look for ways to play the bullish side.
Thanks Stock Trader’s Almanac!
Jay Kaeppel
Chief Market Analyst at JayOnTheMarkets.com and AIQ TradingExpert Pro (http://www.aiq.com) client
http://jayonthemarkets.com/
Chief Market Analyst at JayOnTheMarkets.com and AIQ TradingExpert Pro (http://www.aiq.com) client
http://jayonthemarkets.com/
Jay has published four books on futures, option and stock trading. He was Head Trader for a CTA from 1995 through 2003. As a computer programmer, he co-developed trading software that was voted “Best Option Trading System” six consecutive years by readers of Technical Analysis of Stocks and Commodities magazine. A featured speaker and instructor at live and on-line trading seminars, he has authored over 30 articles in Technical Analysis of Stocks and Commodities magazine, Active Trader magazine, Futures & Options magazine and on-line at www.Investopedia.com.


