Some trading strategies make intuitive sense. Other trading strategies do not. With some trading strategies it is possible to articulate some logical reason or reasons regarding why they might be expected to work well over time. With others trading strategies, well, not so much.
Some trading strategies lend some confidence to a trader. Others offer nothing but a ridiculously good historical track record – and require a trader to make a leap of faith.
For example, consider the following seasonal trading strategy.
The Rules
*On the last trading day of January buy Energies (FSESX)
*On the 1st trading day of May sell Energies
*On the 7th trading day of August buy Biotech (FBIOX)
*On the 9th trading day of September sell Biotech
*On the 19th trading day of October buy Retail (FSRPX)
*On the 20th trading day of November sell Retail
The rest of the time the portfolio is held in cash. For the purposes of this test we will assume that the portfolio earns interest at a rate of 1% per year while in cash.
The Results
We will start our test on 12/31/1988. But before we look at the results of our “system” (such as it is), let’s first create something to compare it to. So for our “comparative result” we will split $1,000 evenly between:
Fidelity Select Energy Services (FSESX)
Fidelity Select Biotechnology (FBIOX)
Fidelity Select Retailing (FSRPX)
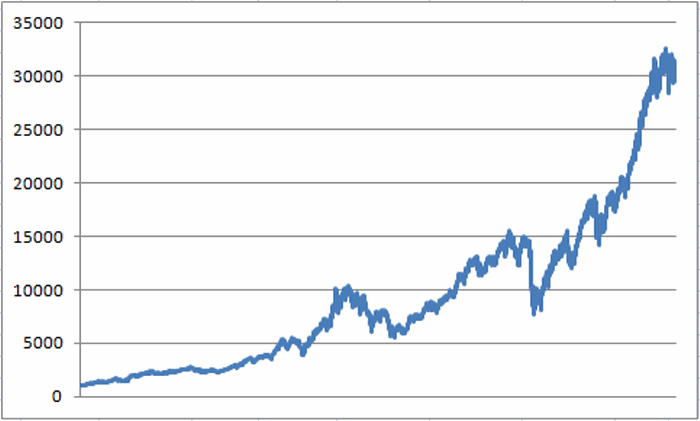
At the end of each year we will rebalance so that each year all three funds start with 1/3 of the portfolio. The daily equity curve for this 3-fund buy-and-hold approach (with an annual rebalancing adjustment) appears in Figure 1.
Figure 1 – Growth of $1,000 in FSESX/FBIOX/FSRPX from 12/31/88 to 12/31/14 (rebalanced annually)
In a nutshell, $1,000 invested this way grew to $31,165 by the end of 2014. This works out to about a +16.3% annual return, which in the technical financial jargon that we “highly trained quantitative analyst” types like to use, “ain’t too shabby.” Of course a close look at Figure 1 reveals some pretty nasty swings along the way. But hey, you “gotta take the good with the bad”, right?
Well, possibly “not.”
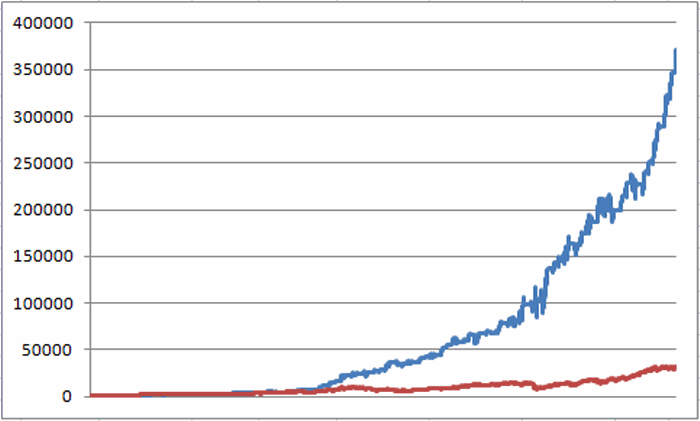
Now let’s look at the results generated following the switching rules listed earlier. The growth of $1,000 invested using this method since the end of 1988 appears in Figure 2 (the blue line). For comparison sake, the results we generated using the buy and hold approach is also displayed in Figure 2 (the red line).
Figure 2 – Jay’s Seasonal System (blue) versus 3 fund buy-and-hold (red); 1988-2014
Despite the fact that you may not be a “highly trained quantitative analyst” type, chances are good that even your untrained eye can pick up on the fact that there is a “discrepancy” between the blue line and the red line in Figure 2.
For the record:
-$1,000 invested using the buy-and-hold approach detailed earlier grew to $31,165, or +3,016% (+16.3% annually).
-$1,000 invested using the seasonal trading rules listed earlier grew to $347,003, or +34,600% (+26.7% annually).
In still more highly technical financial jargon, these types of 11.5-to-1 discrepancies in return are what we refer to as “statistically significant.”
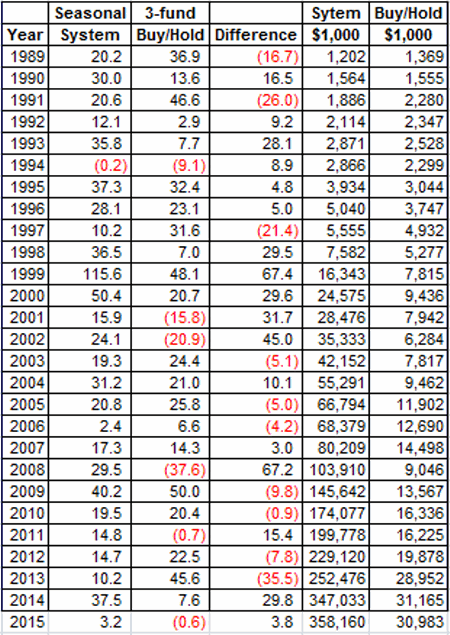
The annual results for both methods are listed in Figure 3.
figure 3 – Results: Jay’s Seasonal System versus Buy-and-Hold (thru 2/4/2015)
A few interesting numbers:
Figure 4 – A few relevant comparative numbers
Other Choices
Fidelity sector funds are not the only choices. Other possible candidates:
XLE Energy Select Sector SPDR (ETF)
IBB iShares Nasdaq Biotechnology (ETF)
XRT SPDR S&P Retail (ETF)
OEPIX ProFunds Oil Equipment (x1.5 leveraged)
BIPIX ProFunds Biotechnology UltraSector (x1.5 leveraged)
CYPIX Profunds Consumer Cyclical (x1.5 leveraged)
Summary
So should every investor simply stop what they’re doing now and just make these three trades every year and sit back and collect their 26%+ per year ad infinitum into the future?
Well it sounds good in theory, but of course the reality – as is the case with any seasonal trend – is that there is no guarantee that these trends will play out as consistently or as strongly in the future as they have in the past.
Which is where the “leap of faith” I mentioned earlier enters into the picture and leads most traders to stand on the “outside looking in.” And maybe that is the wise thing to do.
Still, 26% is 26%. Or to quote the immortal words of Glenn Frey: “The lure of easy money – it’s got a very strong appeal.”
Jay Kaeppel
Chief Market Analyst at JayOnTheMarkets.com and AIQ TradingExpert Pro (http://www.aiq.com) client
http://jayonthemarkets.com/
Chief Market Analyst at JayOnTheMarkets.com and AIQ TradingExpert Pro (http://www.aiq.com) client
http://jayonthemarkets.com/
Jay has published four books on futures, option and stock trading. He was Head Trader for a CTA from 1995 through 2003. As a computer programmer, he co-developed trading software that was voted “Best Option Trading System” six consecutive years by readers of Technical Analysis of Stocks and Commodities magazine. A featured speaker and instructor at live and on-line trading seminars, he has authored over 30 articles in Technical Analysis of Stocks and Commodities magazine, Active Trader magazine, Futures & Options magazine and on-line at www.Investopedia.com.


