There is a lot of hand-wringing going on these days regarding the bond market. And rightly so given that interest rates have been (were?) in a downtrend for 35+ years. Given that, given the long-term cyclical nature of interest rates and given that rates are at a generational low level, “concern” is understandable.
However, needless hand-wringing over events that have yet to occur is not.
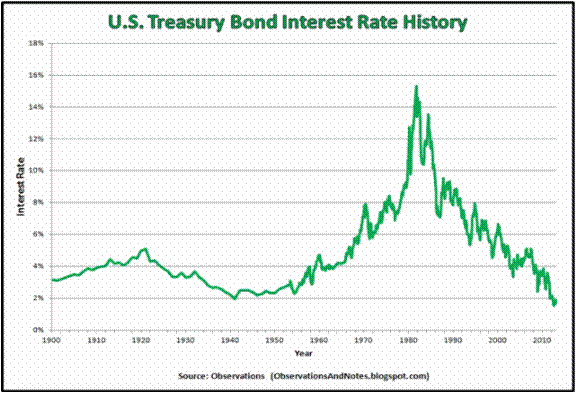
Figure 1 – Long-term treasury yields through the years (Courtesy: ObservationsanNotes.blogspot.com)
(The chart in Figure 1 is updated only through about 2012. Nevertheless, it effectively highlight the long-term cyclical nature of interest rates.)
The problem is the “well, interest rates are destined to rise therefore I should immediately [fill in your defensive action here].”
Many analysts and investors are following and attempting to interpret every tick in bond yields. In fact, some very well known bond “people” have proclaimed a “bond bear market”. And they may be right. But still…
What I Follow in the Bond Market
What follows are a few random thoughts on some of the things I look at when tracking the bond market.
#1. 30-Year Yield versus 120-month Exponential Moving Average
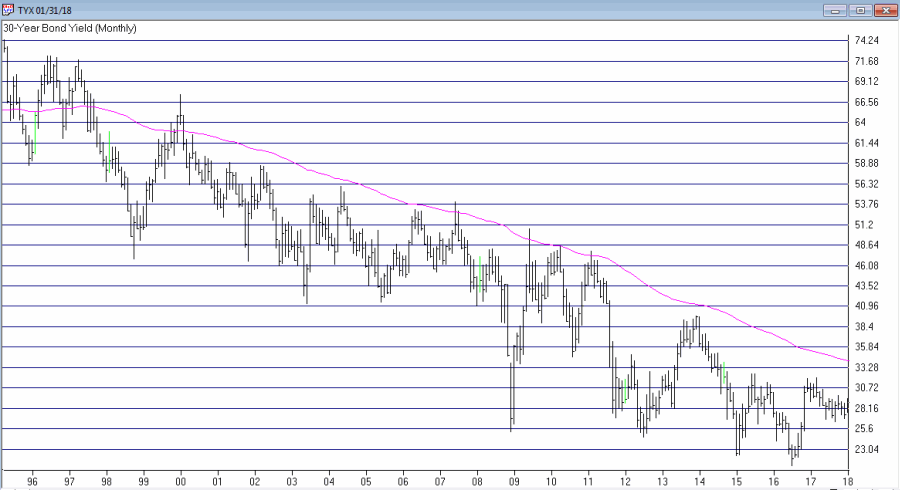
Figure 2 displays ticker TYX, an index which tracks the yields on 30-year bonds (for some reason it multiplies by 10 – so a yield of 3% appears on the chart as 30.00).
Figure 2 – 30-year treasury yields versus 120-month exponential moving average (Courtesy AIQ TradingExpert)
Using the data from Figure 1 I have found that a 120-month (i.e., 10-year) average does a pretty good job of riding the major trends in interest rates. As you can clearly see in Figure 2, TYX is still noticeably below its 120-month EMA. This could obviously change quickly but for the moment by this objective measure the long-term trend in interest rates right at this very moment is still “down.”
Please note that I am not saying that interest rates will not rise and move above this MA. I am saying two things:
1. Until the crossover occurs try not to focus too much attention on dire predictions.
2. Once the crossover does occur the bond market environment that most of us have known throughout all or most of our investment lives will change dramatically (more on this topic when the time is right).
#2. The Yield Curve(s)
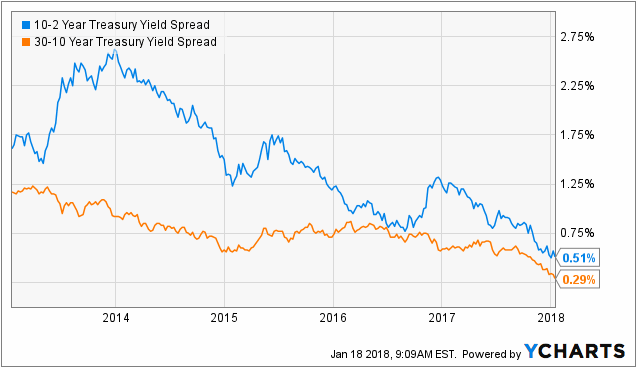
Figure 3 displays the yield curves for 30-year yields minus 10-year yields and 10-year yields minus 2-year yields. The narrowing trend is obvious. This is causing great consternation because historically when the yield curve “inverts” (i.e., when shorter-term rates are higher than longer-term rates) it is a very bad sign for the economy and the financial markets.
Figure 3 – 10-yr yield minus 2-year yield (blue) and 30-year yield minus 10-year yield (orange); (Courtesy: YCharts)
The problem here is that there is still an important difference between “narrowing” and actual “inverting”. Many people seems to look at Figure 3 and assume that an inverted yield curve (i.e., if and when these lines go into negative territory) is “inevitable” and that things are therefore doomed to get worse for the economy and the markets.
Repeating now: There is still an important difference between a “narrowing” yield curve and an actual “inverted” yield curve. Until the yield curve actually does invert try not to focus too much attention on dire predictions.
#3. The Current Trend in Bonds
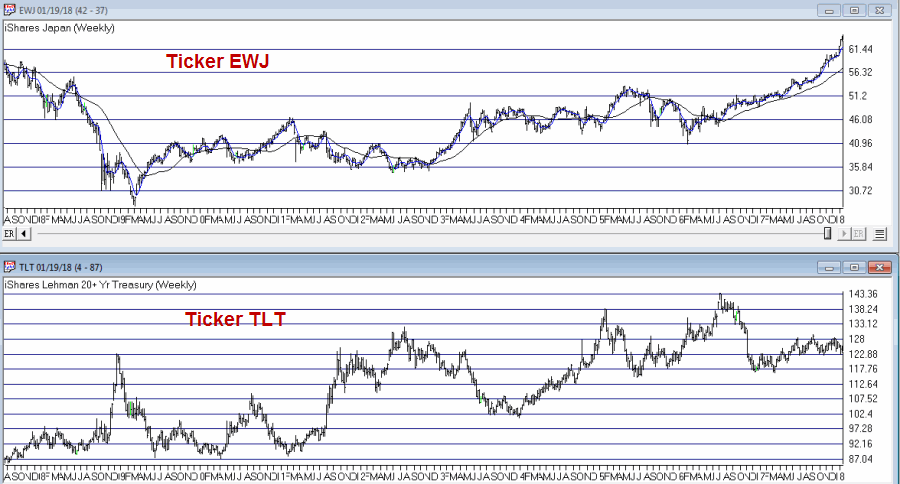
One trend following indicator that I follow (and have written about in the past) is the inverse relationship between long-term t-bonds and Japanese stocks. Figure 4 display ticker EWJ (an ETF that tracks an index of Japanese stocks) versus ticker TLT (an ETF that tracks the long-term treasury bond).
Figure 4 – Ticker EWJ versus Ticker TLT (Courtesy AIQ TradingExpert)
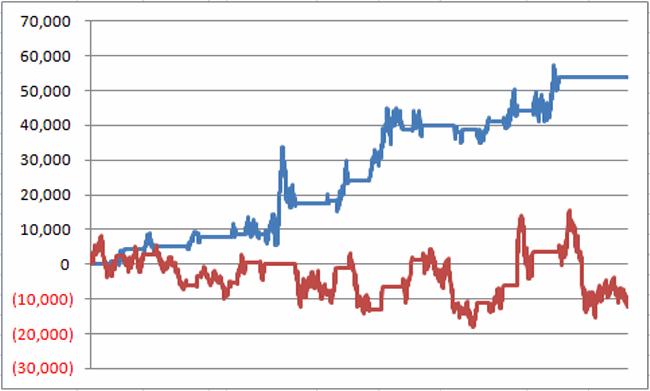
Figure 5 displays two equity curves. The blue line represents the $ gain achieved by holding long 1 treasury bond futures contract ONLY when the EWJ 5-week moving average is below the EWJ 30-wek moving average and the red line represents the $ loss achieved by holding long 1 treasury bond futures contract ONLY when the EWJ 5-week moving average is above the EWJ 30-week moving average.
Figure 5 – Holding long t-bond futures when EWJ is in a downtrend (blue line) versus holding long t-bond futures when EWJ is in an uptrend (red line); December 2003-present
Notice anything different about the blue line versus the red line? With EWJ trending strongly higher, caution remains in order or the long-term treasury bond. If the trend in EWJ reverses things may look better for long-term bonds.
#4. Short and Intermediate Term Bonds remain a Viable Alternative
As I wrote about here an index of short and intermediate treasury and high grade corporate remains a viable long-term approach for income investors. Figure 6 displays the growth of $1,000 invested using the “Boring Bond Index” I wrote about in the aforementioned article. This index has gained in 38 of the past 42 years.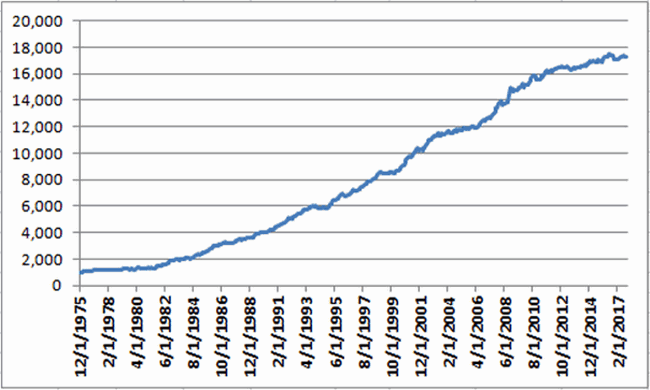

Figure 6 – Growth of $1,000 invested using “Boring Bond Index” Method; 12/31/1975-11/30/2017
Summary
There are good reasons to be wary of interest rates and bonds. At the same time overreacting to dire headlines also remains a very poor approach to investing.
So in sum:
*The very long-term trend in interest rate is still technically “down”
*The yield curve is narrowing but still has a ways to go before it inverts
*The current trend in long-term bonds is bearish
*Short and intermediate term bonds experience much less volatility than long-term bonds (and reinvest more frequently, which may come in handy if rates do begin to rise in earnest).
*If and when TYX pierces its long-term average and/or when the yield curve inverts, the time will arrive for investors to make some wholesale changes in how they approach their bond market investments.
*If and when EWJ starts to fall, things may improve for the current plight of the long-term treasury.
*And through it all, a boring approach to bonds may still prove very useful.
Jay Kaeppel
Disclaimer: The data presented herein were obtained from various third-party sources. While I believe the data to be reliable, no representation is made as to, and no responsibility, warranty or liability is accepted for the accuracy or completeness of such information. The information, opinions and ideas expressed herein are for informational and educational purposes only and do not constitute and should not be construed as investment advice, an advertisement or offering of investment advisory services, or an offer to sell or a solicitation to buy any security.
