I am a fan of “simple” strategies. For the record, yes, I have multiplied the standard deviation of the regression line times the implied volatility of the 90+ day options in order to, in order to, um, well, I seem to recall that there was a really important reason why I did it at the time. Or so it seemed. Still, I am reminded of:
Jay’s Trading Maxim #316: When it comes to analyzing markets and indicators, multiplying (or dividing) two numbers just “because you can”, is not necessarily helpful.
So again, I generally try to keep things simple. Which is great, because the idea in this piece is something I first discovered in the 1990’s, and “trading systems” (such as it is, in this case) don’t get much simpler. So here goes.
When to Own Retailing Stocks
The “system” I discovered in the 1990’s for retailing stocks works like this:
-Buy and hold retailing stocks during the months of February, March, October and November.
That’s it.
As with most things in life there is some good news and some bad news. Let’s start with the bad news. Like a lot of things, this “system” got crushed during the 2008 meltdown, suffering a -48% drawdown.
For those of you who are about to stop reading because of that last figure, just let me say DO NOT STOP READING!
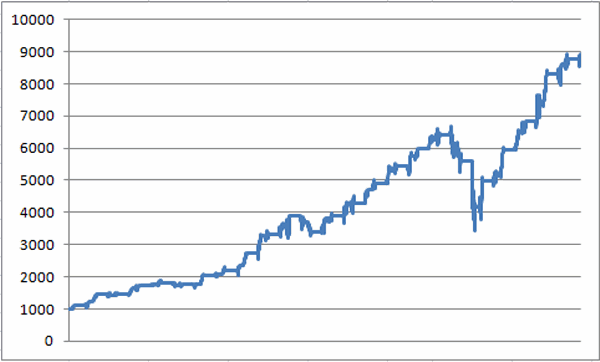
The good news is that despite being fully invested in retailing stocks during the worst meltdown in modern history, the system has since soared to much higher new highs and has outperformed a buy and hold approach by 40% (+791% for the system vs. +562% for buy and hold) since December 1989.
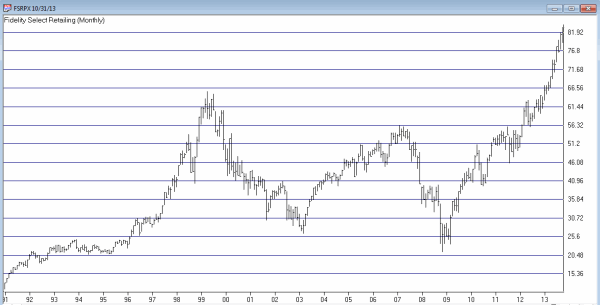
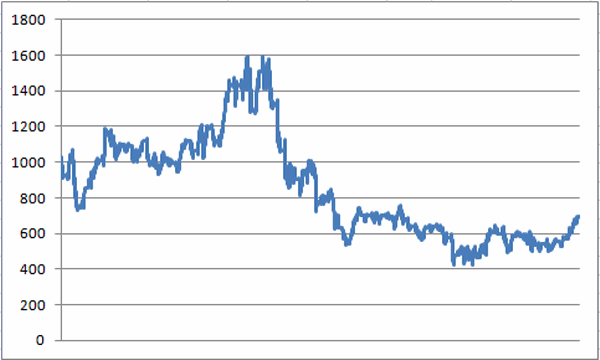
What this means in a nutshell is that if you held retailing stocks only during all eight of the other months every year since 1990, you would actually have lost about -26%. This dichotomy of performance would not seem evident from a cursory glance at Figure 1.
Figure 2 displays the growth of $1,000 invested in Fidelity Select Retailing fund (ticker FRSPX) only during the months of February, March, October and November, starting in December 1989.
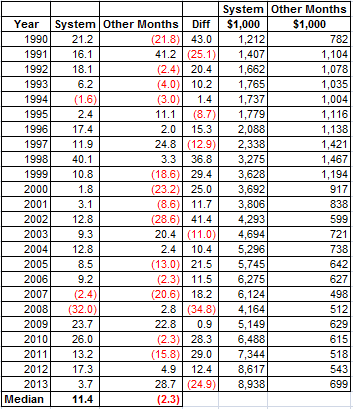
Figure 4 displays the performance of FSRPX during the four “favorable” months (i.e., the “system”) versus the performance of FSRPX during all other months (i.e., the “Anti System”) on an annual basis. The results are fairly striking
A few things to note:
-The System has showed a gain 21 out of 24 years.
-The Anti System showed a gain in only 11 years.
-The System outperformed the Anti System 75% of the time.
-The System showed a net gain of +794%.
-The Anti System showed a net loss of -30%.
Summary
Obviously during some years retailing stocks will rally outside of our four “favorable” months (for example, this year). But the long-term results suggest that investors would do well to focus on retailing stocks during February, March, October and November.
A Note for Option Traders
One less expensive way to make this play is to buy a deep-in-the-money call option on ticker XRT (SPDR Retail ETF). Here is an example:
-On 9/30/2013 a trader could have purchased 400 shares of XRT at $82.01 a share. The cost of this trade would be $32,804. The net delta of this position is 400.
-An option trader could have bought 5 December XRT 76 call option at $6.90. The cost of this trade would be $3,450. This option has a delta of 81.29, so buying 5 contracts yields a net delta of 401.26. In other words, this position will behave just like the stock position, but at a fraction of the cost ($3,450 versus $32,804).
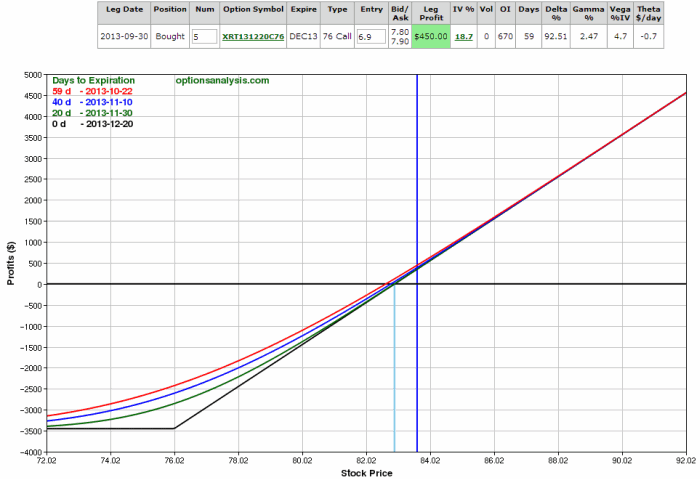
Figure 6 –XRT December 76 call option as a replacement for stock shares (Courtesy: www.OptionsAnalysis.com)
