The Stock Trader’s Almanac, put out each year by the Hirsch Organization, is one of my favorite publications. Interesting ideas are one thing. Interesting ideas that actually work are entirely something else. And the Almanac is chock full of just that.
Of course, some of us are not content to leave well enough alone (Hi, my name is Jay). One system that I follow involves using the Almanac’s “Nasdaq’s Best Eight Months Strategy” with MACD Timing. However, instead of buying a stock index I focus on the top performing Fidelity Select Sector Funds.
The method works like this:
-Starting on October first, track the action of the MACD indicator for the Nasdaq Composite Index using MACD parameter values of 8/17/9.
-When the fast line crosses above the slow line – or if the fast line is already above the slow line on 10/1, a buy signal occurs.
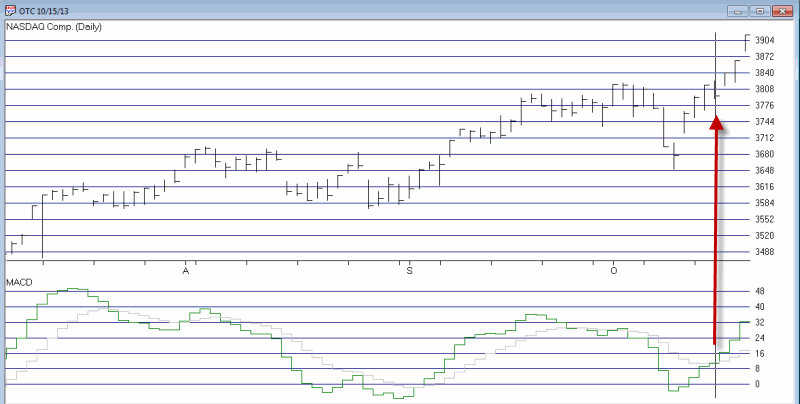
Figure 1 displays the most recent buy signal which occurred at the close on 10/15/13.
-Then find the five top Fidelity Select sector funds.
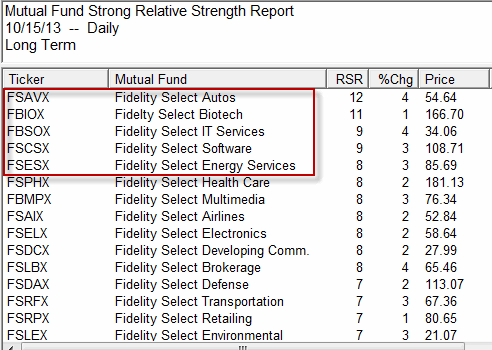
There are a number of different ways to do this. The method I use is to run AIQ TradingExpert Relative Strength report over the past 240 trading days. This routine looks at the performance of each fund over 240 trading days but gives extra weight to the most recent 120 days. You can use different variables, or you can simply look at raw price change over the previous 6 months to come up with a list of “Top Select Sector Performers.” The list for 10/15/13 appears in Figure 2.
-Buy the top five Select Sector funds the next day.
-Starting on June 1st of the next year, track the action off the MACD indicator for the Nasdaq Composite Index using MACD parameter values of 12/25/9.
When the fast line crosses below the slow line – or if the fast line is already above the slow line on 6/1, then sell the Fidelity Select sector funds on the next trading day.
Repeat.
Results
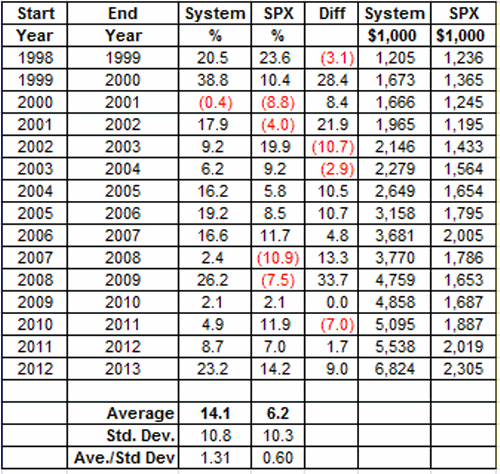
The test period used here starts in October of 1998. The year-by-year results of this system during the Favorable eight month period versus the performance of the S&P 500 Index during the same time appears in Figure 3.
Figure 3 – Year-By-Year Bullish Eight Months (System vs. SPX)
|
Measure
|
System
|
S&P 500 Index
|
|
Number of times UP
|
14 (93%)
|
11 (73%)
|
|
Number Times Down
|
1(7%)
|
4 (27%)
|
|
Number time better performer
|
11
|
4
|
|
Average % +(-)
|
+14.1%
|
+6.2%
|
|
Worst %+(-)
|
(-0.8%)
|
(-10.9%)
|
Figure 4 – System versus S&P 500 during “Bullish Eight Months”
Summary
As you can see, this relatively simple system has registered a gain in 14 of the past 15 “bullish” eight month periods. On average it has outperformed the S&P 500 by a factor of 2.27-to-1.
So does any of this mean that a portfolio of FSAVX/FBIOX/FBSOX/FSCSX/FSESX is sure to make money and outperform the S&P 500 between now and June of 2014? Sadly, no.
I guess I’ll just have to take my chances.
Jay Kaeppel
Jay has published four books on futures, option and stock trading. He was Head Trader for a CTA from 1995 through 2003. As a computer programmer, he co-developed trading software that was voted “Best Option Trading System” six consecutive years by readers of Technical Analysis of Stocks and Commodities magazine. A featured speaker and instructor at live and on-line trading seminars, he has authored over 30 articles in Technical Analysis of Stocks and Commodities magazine, Active Trader magazine, Futures & Options magazine and on-line at www.Investopedia.com.


