The AIQ code based on Barbara Star’s article in January issue of Stocks & Commodities, “The DMI Stochastic,” is provided at www.TradersEdgeSystems.com/traderstips.htm.
To test the author’s DMI stochastic indicator, I used the NASDAQ 100 list of stocks and AIQ’s Portfolio Manager. A long-only trading simulation was run with the following capitalization, cost, and exit settings:
- Maximum of 10 open positions
- Size each position at 10 % of mark-to-market total capital
- Take no more than three new positions per day
- Compute the mark-to-market capital each day
- Three cents per share was deducted for each round-turn trade
- Select trades based on the highest ADX reading
- Exit trades only with a system exit; no loss-stop or profit target stop used.
I coded three similar test systems. The first is the basic system that uses the author’s parameters of 10 (buy signal) and 90 (sell signal) on the DMI stochastic indicator. A stock has a buy signal when it has both a positive DMI oscillator and the DMI stochastic is below the buy level.
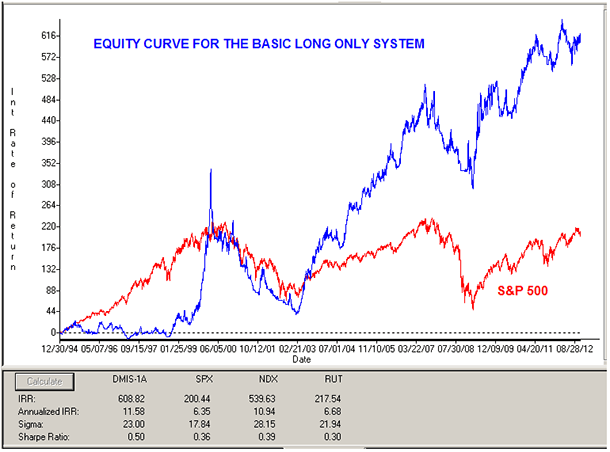
In Figure 6, I show the resulting long-only equity curve compared to the S&P 500 index for the basic system with the 10 buy-level parameter. For the period 12/30/1994 to 11/9/2012, the system returned an average internal rate of return of 11.6% with a maximum drawdown of 68.7% on 2/6/2003 and a Sharpe ratio of 0.50.
I also tried increasing the buy-level parameter up to 70, which improved the return somewhat. I added a trend filter using the 50-bar moving average of the S&P 500 index, but it resulted in a reduced return without improving the maximum drawdown very much. The equity curve for this test is not shown. For the period 12/30/1994 to 11/9/2012, this system returned an average internal rate of return of 8.5% with a maximum drawdown of 46.1% on 10/2/1998 and a Sharpe ratio of 0.46.
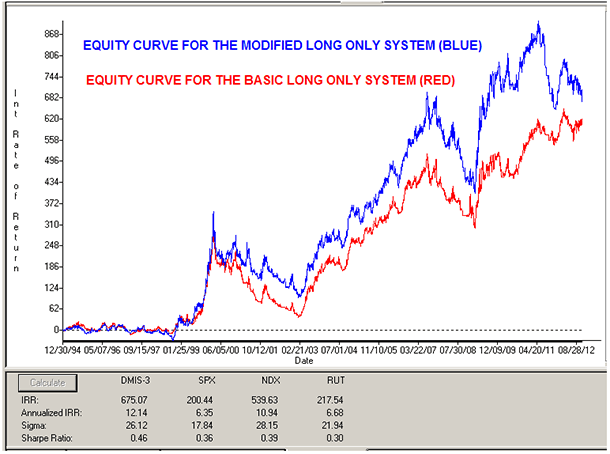
Finally, I tried adding an ADX filter such that the ADX level had to be above 30 to allow a signal. However, I also left the buy level at the high value of 70. In Figure 7, I show the resulting long-only equity curve for the basic system versus this modified ADX system. For the period 12/30/1994 to 11/9/2012, the system returned an average internal rate of return of 12.1% with a maximum drawdown of 56.1% on 2/6/2003 and a Sharpe ratio of 0.46.
The code and EDS file can be downloaded from www.TradersEdgeSystems.com/traderstips.htm, and is shown below.
!THE DMI STOCHASTIC
!Author: Barbara Star, TASC January 2013
!Coded by: Richard Denning 11/05/12
!www.TradersEdgeSystems.com
!INPUTS:
wLen is 10.
sLen is 3.
buyLvl is 70.
exitBuyLvl is 0.
sellLvl is 55.
exitSellLvl is 0.
!CODING ABREVIATIONS:
H is [high].
L is [low].
C is [close].
C1 is valresult(C,1).
H1 is valresult(H,1).
L1 is valresult(L,1).
! NOTE: Wilder to expontential averaging the formula is:
!  Wilder length * 2 - 1 = exponential averaging length
eLen is wLen * 2 - 1.
!AVERAGE TRUE RANGE:
TR  is Max(H-L,max(abs(C1-L),abs(C1-H))).
ATR  is expAvg(TR,eLen).
!+DM -DM CODE:
rhigh is (H-H1).
rlow is (L1-L).
DMplus is iff(rhigh > 0 and rhigh > rlow, rhigh, 0).
DMminus is iff(rlow > 0 and rlow >= rhigh, rlow, 0).
AvgPlusDM is expAvg(DMplus,eLen).
AvgMinusDM is expavg(DMminus,eLen).
!DMI CODE:
PlusDMI is (AvgPlusDM/ATR)*100.
MinusDMI is AvgMinusDM/ATR*100.
!DMI OSCILATOR:
DMIosc is PlusDMI - MinusDMI.   !Plot as historigram
!STOCHASTIC OF DMI:
HH is highresult(DMIosc,wLen).
LL is lowresult(DMIosc,wLen).
DMI_STOCH is (DMIosc - LL) / (HH - LL) * 100.
DMI_STO_SK is simpleavg(DMI_STOCH,sLen).
DMI_STO_SD is simpleavg(DMI_STO_SK,sLen).  !Plot with 90/10 lines
!SYSTEM TO TEST INDICATOR:
!BASIC SYSTEM WITH AUTHOR'S SUGGESTED PARAMETERS:
Buy if DMIosc > 0 and DMI_STO_SD <= 10.
ExitBuy if DMIosc < 0.
Sell if DMIosc < 0 and DMI_STO_SD <= 90.
ExitSell if DMIosc > 0.
!SYSTEM WITH TREND FILTER AND MODIFIED PARAMETERS (LONG ONLY):
SPXc is tickerUDF("SPX",C).
SPXma is simpleavg(SPXc,50).
BuyT if DMIosc > exitBuyLvl
and DMI_STO_SD <= buyLvl
and SPXma > valresult(SPXma,10).
ExitBuyT if DMIosc < exitBuyLvl or SPXma < valresult(SPXma,10).
!SYSTEM WITH TREND STRENGTH FILTER AND MODIFIED PARAMETERS (LONG ONLY):
BuyADX if DMIosc > exitBuyLvl
and DMI_STO_SD <= buyLvl
and ADX > 30.
ExitBuyADX if DMIosc < exitBuyLvl.
!SIGNAL RANKING( use ADX):
ZERO if PlusDMI = 0 and MinusDMI = 0.
DIsum is PlusDMI + MinusDMI.
DX is iff(ZERO,100,abs(DMIosc)/DIsum*100).
ADX is expavg(DX,eLen).
List if C > 0.


