As I mentioned last time around, when it comes to analyzing the financial markets, I am a proud graduate of “The School of Whatever Works”. In my youth I “wrote down” a lot of interesting analysis ideas (that’s how we did it back then, sadly).
Whenever I would hear or read of a new market analysis or market timing idea, rather than passing judgment one way or the other based solely on my own “youthful wisdom” (har, good one), I would agnostically write it down and “track it for awhile”. OK, “quantitative” is not a word that most “youths” get around to using until, well, whatever it is that comes after youth (which I believe most people refer to as “Mid-20’s and broke”, or alternatively, “Our parents have stopped feeding us, now what?” But I digress).
At lunch time I would take a break from my job in “Personnel” (which coincidentally is where I came to realize that I “hate people” and that I was going to have to do something that involved numbers instead) and go to the local library and peruse the available market newsletters, advisory services, etc. Anyway, I had quite the appetite for “market analysis” so I “wrote down” a lot of “stuff.”
Long story short, if I had a $1 for every idea/method I wrote down that did not stand the test of time, well, let’s just say I wouldn’t need to worry about analyzing the financial markets anymore. But I guess that shouldn’t really come as a surprise. What surprises me more is some of the ideas that I would likely have considered “arcane” (had I actually used that word in my youth) that actually did end up standing the test of time (at least so far). One of those is something I refer to as the “40-week cycle.“
Now I am certain that I personally did not “invent” the 40-week cycle. I must have read about it somewhere (OK, original thinking isn’t my strong suit, is that a crime?),written it down and followed it. But sadly, I don’t remember exactly when or where or from whom I first got the idea. But whoever you are, if by some strange twist of fate you are reading this article, let me just say “Thanks.”
The 40-Week Cycle
For the record there is the “Raw theory 40-week cycle” and the “Raw theory 40-week cycle with a stop-loss provision added because you know how that pesky stock market loves to crater even the best theories every once in a while” version (which I considered as the title for my next book but my editor emphatically said “No!” Guess the price of ink must be up these days).
The Rules are pretty simple:
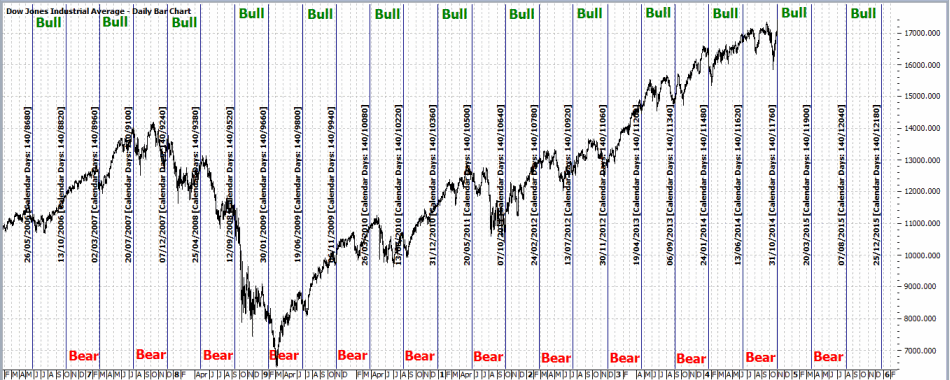
*Starting at the close on 4/21/1967, the first 140 calendar days (20 weeks times 7 days) is considered the “Bullish Phase”
*The second 140 calendar days is considered the “Bearish Phase”
*During the Bullish Phase, if the Dow Jones Industrials Average losses 12.5% or more from its closing level at the end of the previous “Bearish Phase”, sell and remain in cash until the start of the next Bullish Phase.
Figure 1 displays this cycle going back a few years.
There are three critical things to know about the raw 40-week cycle:
1) The stock market DOES NOT always go UP during each bullish phase.
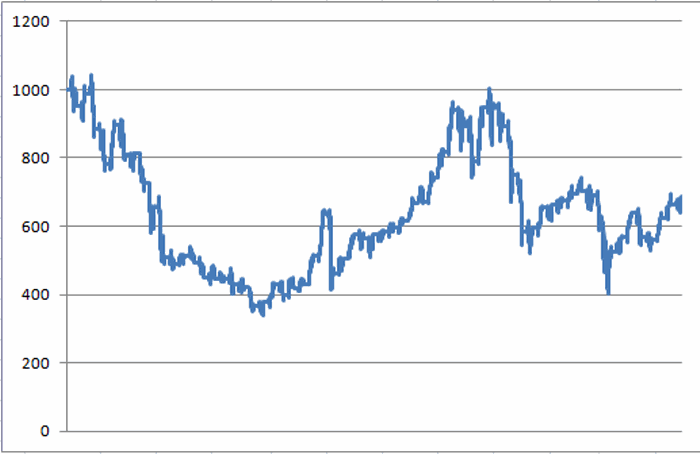
2) The stock market DOES NOT always go DOWN during each bearish phase (in fact, for the record, the “Bearish Phase” has seen the Dow advance more often than it declined. But when it does decline, it “really declines” – see Figure 3 below).
3) No one should rely on the 40-week cycle as their sole method of market analysis (even at the peak of “Youthful Wisdom”)
With those caveats in mind, let’s look at why it still may be useful to keep an eye on this cycle as a “weight of the evidence” tool.
The Results
For measuring results during the “bullish” phase:
Buy the Dow at the close on the last day of the previous Bearish cycle.
Sell if either:
a) The Dow declines 12.5% or more on a closing basis from the buy price, or;
b) 140 calendar days go by if a) is not triggered
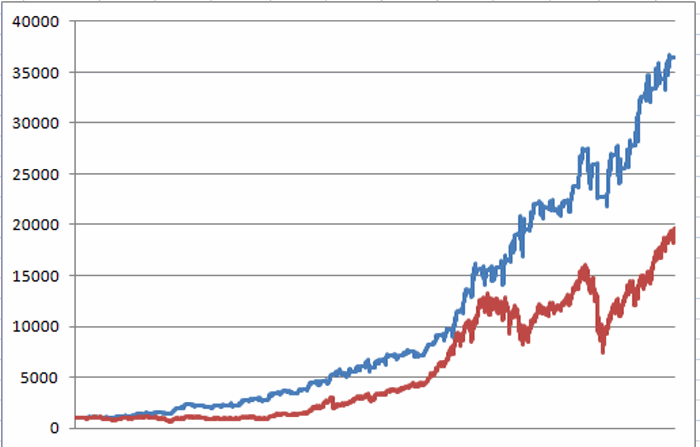
For our purposes, we will assume that interest is earned at a rate of 1% per year while out of the stock market. Starting on 4/21/67, $1,000 invested using the rules above would be worth $36,483 as of 10/31/14, as shown in Figure 2.
On the flip side, had an investor skipped all of the “bullish” days and invested only during the “bearish” days (including after the 12.5% stop was hit), he or she would have done, ahem, worse. The growth of $1,000 invested only during the “non bullish” days appears in Figure 3.
To be succinct:
*$1,000 invested only during the “Bullish” days grew to $36,483 (+3,548%)
*$1,000 invested only during the “Non Bullish” days shrank to $688 (-31%)
Summary
The latest bullish phase started at the close of trading on 10/31/2014 (and extends through 3/20/15). This nicely coincides with the “Bullish Six Months” period originally espoused by Yale Hirsch which (according to my own rules) extends from the close of trading on October 31st each year through the third trading day of the following May. So does this combination of bullish seasonal factors guarantee us that “Happy Day are Here Again?”
Sadly, no. Murphy and his d$%^ Law stand ever vigilant against complacent investors. But if history is a guide (and “sometimes” it is) we might continue to give the bullish case the benefit of the doubt.
Well, at least for another 139 days.
Jay Kaeppel
Chief Market Analyst at JayOnTheMarkets.com and AIQ TradingExpert Pro (http://www.aiq.com) client
http://jayonthemarkets.com/


