Simple moving averages are not rocket science. They provide a benchmark from which any given days price can be measured for it’s degree of deviation from the average. Crossovers of moving averages by price action whether to the upside or downside are not so much buy or sell points as warning signs. Of course it depends on your moving average. Historically a 200-day arithmetic for the NASDAQ has provided a pretty good indication of the long trend. Dramatic breaks through this average often spell a trend change. Now add in a shorter moving average like the 50-day and a little more clarity appears.
Take a look at the NASDAQ going back to early 2006 in the chart below. When the 50-day is above the 200-day and both are rising, this is the time when bulls hold the court.
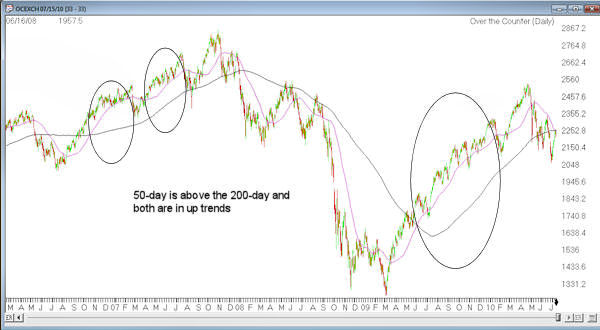
Conversely when the 50-day is blow the 200-day and both are falling, this is the time when bears reign.

This is not a timing mechanism for entering or exiting, merely a confirmation of which direction the market is going when these averages display this pattern.
In other market conditions these moving averages will be trending differently from each other and the picture is mixed.
So to the last few days July 13 – 15, 2010. We are at a confluence of the 50-day moving average and the 200-day moving average. The 50-day is in a down trend and now just crossing the 200-day. Yet the 200-day is barely turning down, and has been moving back up in the last 2 days. Until there is a clear down trend in the 200-day, with the 50-day still below and also down trending the sweet spot for shorts is still not in place.
One interesting point to note. The price is also very close to the moving average confluence. The last time this setup occurred was back in May 2005. Check out the chart below. Notice the similarities between May 9, 2005 and July 15, 2010?


Back in 2005 the confluence resolved to the upside, with the market rebounding more than 10% in 2 1/2 months, eventually meeting resistance at the prior high. July 2010 more time is required for the averages to play out before we have an idea where the market is headed.
