The AIQ code for Vladimir Vladimirovich Voznjuk’s article in this issue, “Developing A Multilevel Strategy,” is provided at www.TradersEdgeSystems.com/traderstips.htm, and is shown below.
Although AIQ software can chart and test forex data, testing stocks is more interesting. Using the author’s concept of trading using multiple instruments to generate signals, I designed a system that uses both the group index for a stock and the SPX. The multi-instrument indicator that I designed uses the 20-day rate of change in price for the stock and its related group, which is then smoothed by a simple average over 20 days. I then take a ratio of the stock’s smoothed rate of change to its related group’s smoothed rate of change. Finally, I take a stochastic of this ratio (“StoMSG”). The system goes long when the stock, group, and SPX index are in uptrends as measured by the direction of their 50-day simple moving average (higher than it was 10 days ago) and in addition, for the stock and group, the 20-day rate of change is greater than zero. Buy when the trend is up (as defined here) and the StoMSG is less than or equal to 10. Exit longs when one of the following is met: the position has been held for 20 days, or the StoMSG is greater than or equal to 90, or the simple average of the SPX close is less than its value 10 days ago.
To test the multimarket group stock system using the Portfolio Manager for the period 1/1/1999 to 7/18/2012, a trading simulation was run with the following capitalization settings:
– Maximum of 10 open positions
– Size each position at 10% of mark-to-market total capital
– Take no more than 10 new positions per day
– Compute the mark-to-market capital each day
– Choose signals based on a relative strength indicator for ranking in descending order for longs (long-only system)
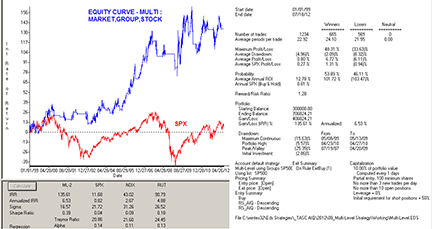
In Figure 1, I show the resulting statistics and equity curve compared to the SPX. The test was run using the S&P 500 group/section structure that can be downloaded from the AIQ website for the period 1/1/1999 to 7/18/2012. AIQ allows for the creation of custom group and sector structures and also has two structures, the S&P 500 and the AIQALL. The S&P 500 groups contain just the stocks in the S&P 500, while the AIQALL groups have most of the stocks that can be traded.
!Author: Vladimir Voznjuk, TASC Sept 2012
!Coded by: Richard Denning 7/16/2012
!www.TradersEdgeSystems.com
! ABBREVIATIONS:
C is [close].
Cx is valresult(C,20).
O is [open].
avgV is simpleavg([volume],50).
PEP is {position entry price}.
PD is {position days}.
Name is description().
Group is tickerUDF(rsTicker(),name).
GrpSym is tickerUDF(rsTicker(),symbol()).
GrpO is tickerUDF(rsTicker(),O).
GrpC is tickerUDF(rsTicker(),C).
GrpCx is valresult(GrpC,20).
!UDFs FOR INDICATOR & SYSTEM:
StkCOPct is simpleavg((C – Cx ) / Cx * 100,20).
GrpCOPct is simpleavg((GrpC – GrpCx) / GrpCx * 100,20).
MA50 is simpleavg(C,50).
GrpMA50 is simpleavg(GrpC,50).
SPXma50 is tickerUDF(“SPX”,MA50).
MSG is StkCOPct / GrpCOPct.
!PLOT THE FOLLOWING WITH 90 & 10 LINES:
StoMSG is (MSG – lowresult(MSG,60)) /
(highresult(MSG,60) – lowresult(MSG,60)) * 100.
!REPORT TO LIST VALUES FOR A SINGLE DAY:
ShowValues if StkCOPct > 0
and MA50 > valresult(MA50,10)
and GrpCOPct > 0
and GrpMA50 > valresult(GrpMA50,10)
and C > 10 and avgV > 3000.
!TRADING SYSTEM RULES:
Buy if StoMSG <= 10
and StkCOPct > 0
and MA50 > valresult(MA50,10)
and GrpCOPct > 0
and GrpMA50 > valresult(GrpMA50,10)
and C > 0 and avgV > 3000
and SPXma50 > valresult(SPXma50,10).
ExitBuy if StoMSG >= 90
or PD >= 20
or SPXma50 < valresult(SPXma50,10).
!FOR RANKING SIGNALS FOR TRADING SIMULATION
! IN PORTFOLIO MANAGER:
!AIQ RELATIVE STRENGTH:
Price1 is C.
Price2 is O.
MTL is 30.
Q3m is MTL / 4.
Q2m is (MTL – Q3m) / 3.
Q1m is (MTL – Q2m – Q3m) / 2.
Q0m is MTL – Q1m – Q2m – Q3m.
ROCq3m is (valresult(price1,Q2m,(Q1m+Q0m)) /
valresult(price2,Q3m,(Q2m+Q1m+Q0m)) – 1) * 100.
ROCq2m is (valresult(price1,Q1m,Q0m) /
valresult(price2,Q2m,(Q1m+Q0m)) – 1) * 100.
ROCq1m is (valresult(price1,Q0m,0) /
valresult(price2,Q1m,Q0m) -1 ) * 100.
ROCq0m is (price1 / valresult(price2,Q0m,0) – 1) * 100.
RS_AIQ is ROCq0m * 0.40 + ROCq1m * 0.20
+ ROCq2m * 0.20 + ROCq3m * 0.20.


