The importable AIQ EDS file based on John Ehlers’ article in the October issue of Stocks & Commodities, “Cycle/Trend Analysis And The MAD Indicator,” can be obtained on request via email to info@TradersEdgeSystems.com.
John Ehler introduces the moving average difference (MAD) indicator where the moving average lengths are different by approximately half the period of the dominant cycle in the data.
The code is also available below. Code for the author’s indicator is set up in the AIQ code file.
!CYCLE/TREND ANALYTICS AND THE MAD INDICATOR
!Author: John F. Ehlers, TASC Oct 2021
!Coded by: Richard Denning, 8/15/2021

!MAD (Moving Average Difference) Indicator
!(C) 2021 John F. Ehler

Shortlength is 8.
LongLength is 23.
MAD is 100*(simpleavg([Close], ShortLength) -
    simpleavg([Close], LongLength)) /
    simpleavg([Close], LongLength).
Figure 9 shows the MAD indicator on a chart of Tesla, Inc. (TSLA).
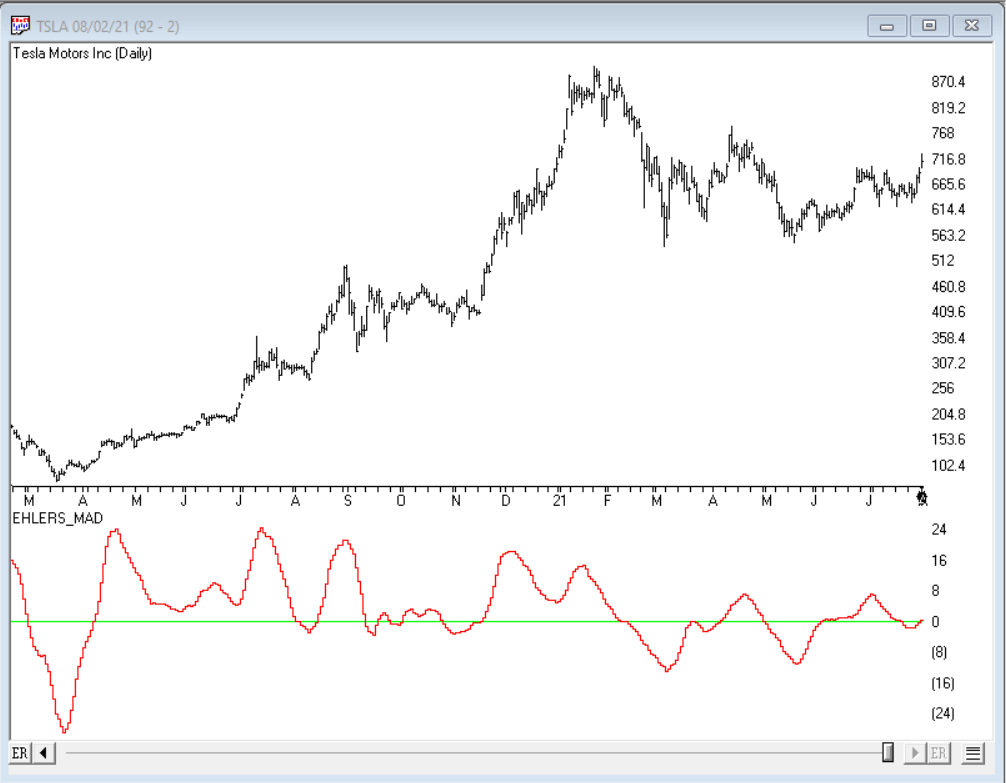
FIGURE 9: AIQ. This shows a chart of Tesla, Inc. with the MAD indicator applied.
—Richard Denning
info@TradersEdgeSystems.com
for AIQ Systems