Automated test via XML-RPC.
Category Archives: Uncategorized
XML-RPC Test Post
Automated test via XML-RPC.
AIQ TradingExpert Pro Market Timing Update – October 19, 2025
AI Confirms a Strong Market Sell Signal
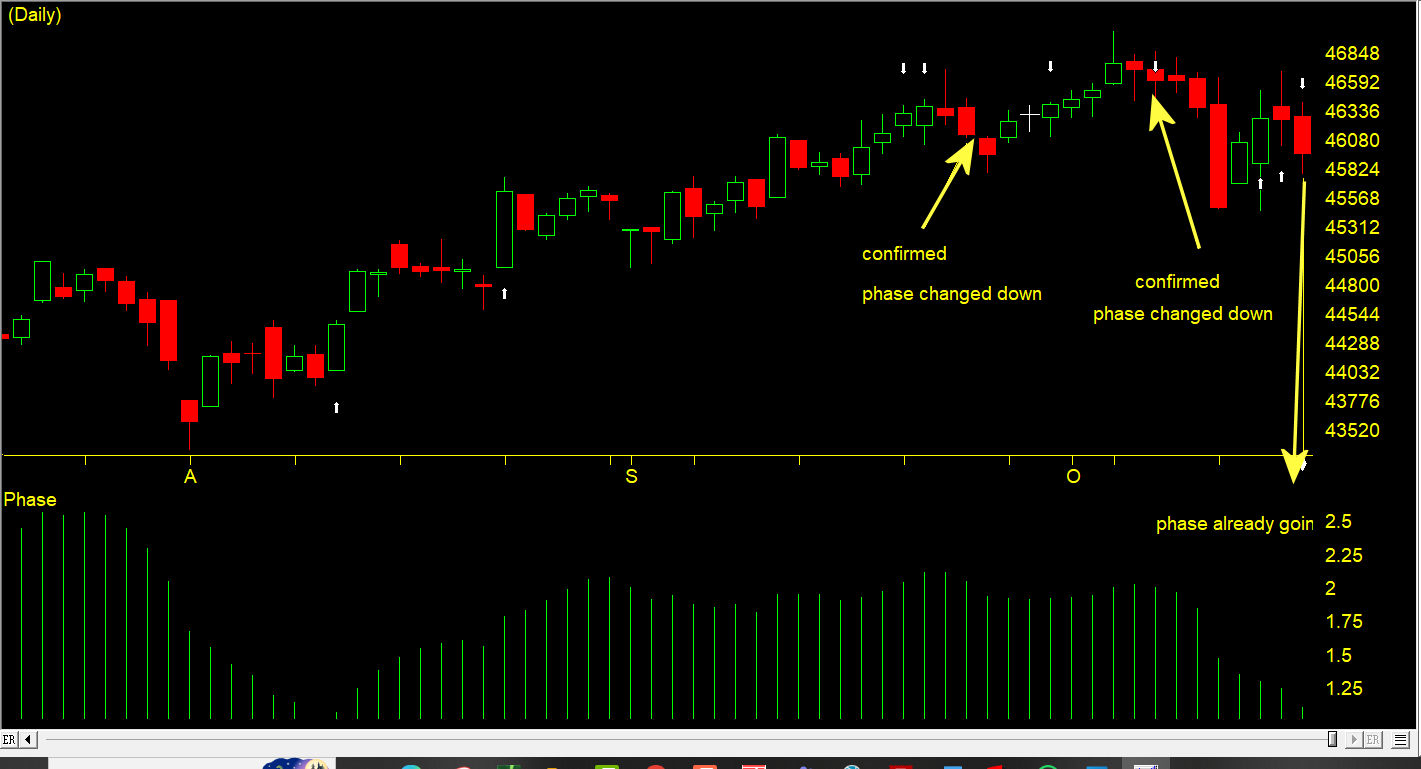
AIQ TradingExpert Pro’s market-timing system fired a strong confirmed sell signal on October 16, 2025, marking a notable shift in market momentum.
This follows two unconfirmed buy signals earlier in the week and a prior confirmed down signal on October 7, which correctly preceded a 1100-point market drop over the next three sessions.
While the mid-month buy attempts suggested possible support, the AI-based phase model never confirmed a trend reversal — and as of now, the bears are clearly regaining control.
⚙️ What Triggered the October 16 Sell Signal
AIQ’s expert system combines multiple technical indicators to identify major turning points.
On October 16, several key bearish rules fired simultaneously — a rare and powerful confluence:
Price Phase, Volume Accumulation %, and Advance/Decline Oscillator are All Decreasing
In a sideways market, this cluster is viewed as a short-term bearish setup, often preceding a decline in prices.
Exponentially Smoothed Advance/Decline Line Turns Negative
When combined with negative readings in both the Up/Down Volume Oscillator and Advance/Decline Oscillator, this signals broad internal market weakness and precedes downward pressure.
Up/Down Volume Oscillator Turns Negative
Reinforcing bearish momentum — this condition historically confirms that buyers are losing control of volume leadership.
Advance/Decline Oscillator Turns Negative
When all three internal breadth measures align to the downside, AIQ interprets this as a strong probability of a continued short-term decline.
New High/New Low Indicator Reverses to the Downside
This is one of the system’s most reliable bearish signals. In a sideways market, it often marks the early stage of a new downtrend.
📉 Recent Market History
October 7, 2025: Confirmed down signal. Followed by a 110-point market drop over the next three days. Driven by internal breadth weakness and a reversal in the New High/New Low indicator.
October 13–14: Two short-lived buy signals appeared but were not confirmed by phase change — indicating limited upside conviction.
October 16, 2025: Confirmed strong sell signal (100 strength) — multiple bearish rules aligned across price, volume, and breadth.
🔎 AIQ’s Interpretation
In the current sideways-to-rolling-over market, the system views this cluster of signals as a warning that a new short-term downtrend may be underway.
While confirmation from price action is still developing, internal data — especially breadth and volume metrics — show deterioration beneath the surface.
Traders should remain cautious, tighten stops on long positions, and prepare for potential follow-through to the downside.
🧩 Key Takeaway
AIQ TradingExpert Pro’s expert system is once again highlighting the power of combining breadth, volume, and price phase indicators to identify turning points before they appear in the indexes.
The October 16 cluster of bearish rules echoes the early October pattern — suggesting that weakness beneath the surface is deepening, and the path of least resistance may remain downward in the near term.
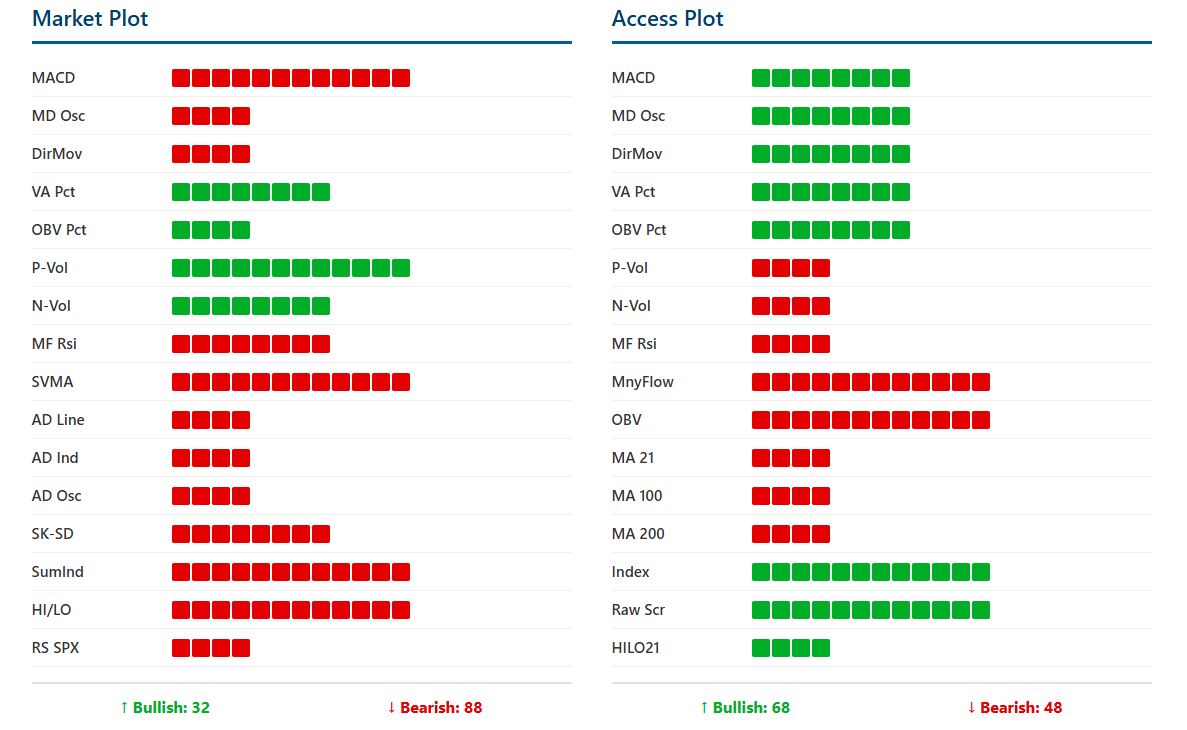
The visual representation below of the AI system on 10-16-25 on the market shows a majority bearish sentiment in the internal market indicators, whereas the Access Plot (all 500 of the SP 500 stocks measured by technical indicators) shows a mixed sentiment.
AIQ’s Market Timing AI Flags Early Sell Signals: What They Mean for Traders
AIQ’s Market Timing Expert System has recently fired off three consecutive sell signals on September 19th, September 22nd, and September 30th, 2025. While the Dow Jones Industrial Average (DJIA) and broader market remain in an uptrend, the AI is warning that internal conditions beneath the surface are deteriorating.

The visual representation below of the AI system on 9-30-25 on the market shows a broad bearish sentiment in the internal market indicators. In contrast, the Access Plot (all 500 of the SP 500 stocks measured by technical indicators) show the current bullish sentiment.

The Signals That Triggered
September 19th, 2025:
- Closing prices rose for three straight sessions on rising volume, a textbook bullish pattern. But beneath this strength, AIQ’s oscillators picked up negative divergences.
- The Advance/Decline Oscillator turned negative despite new 21-day highs in intraday prices – a classic warning that fewer stocks are participating in the rally.
- The Up/Down Volume Oscillator also flashed negative, signaling that selling pressure outweighs buying pressure even as prices tick higher.
September 22nd, 2025:
- The same divergence repeated: intraday highs at a 21-day peak, but both Advance/Decline and Up/Down Volume Oscillators stayed negative.
- Adding weight, the New High/New Low Indicator reversed to the downside – a reliable marker that momentum could be stalling, often ahead of trend reversals.
September 30th, 2025:
- Again, intraday highs hit a 21-day peak. Yet in a now sideways market, the Up/Down Volume Oscillator remained negative. This suggests distribution: institutions selling into strength rather than adding exposure.
Why the Signals Point Down
These warnings all point to the same underlying theme: the rally is narrowing, and internals are weakening. While prices look strong at the index level, breadth and volume indicators show stress beneath the surface. Historically, such divergences often precede a downturn, as buyers run out of fuel and sellers step in with force.
Why the Signals Are Often Early
It’s important to note that AIQ’s Expert System is designed to be early rather than late. By the time the majority of market participants “see” the decline, much of the downside has already occurred. The AI often highlights conditions that can lead to a reversal, but not necessarily on the very next day.
In practice, these signals function as yellow lights:
- They don’t always mean “sell everything immediately.”
- They do mean that traders should tighten risk controls, raise stops, and prepare for volatility.
If multiple signals cluster, as they have now, the probability of a corrective move rises.
What Traders Should Watch
Going forward, confirmation would come if:
- The DJIA breaks recent support levels on volume.
- Breadth and volume indicators continue to weaken.
- More new lows expand relative to new highs.
Until then, these sell signals are the market’s way of whispering a warning: the uptrend may not be as solid as it appears.
 | AIQ Systems Stephen Hill CEO |
Unlock the Six Secrets to Successful Trading – Get Your Free Guide Now

Most traders struggle because they don’t know the real secrets behind consistent profits https://aiqeducation.com/show-me-six-secrets/
Survivorship Bias and Index weighting in Market Indices: What Traders Need to Know
When traders look at long-term index performance charts, it’s tempting to assume they reflect the “true” experience of investors over time. But there’s a hidden distortion baked into indices like the S&P 500 and Russell 2000: survivorship bias. This bias occurs because failing companies are regularly removed and replaced by stronger firms, making historical index performance look healthier than what an actual buy-and-hold investor might have experienced.
How Survivorship Bias Skews the S&P 500
The S&P 500 is marketed as a snapshot of the 500 largest U.S. companies, but the membership list is far from static. Every year, dozens of names are swapped in and out. Companies that go bankrupt or underperform are removed, while stronger or fast-growing companies are added.
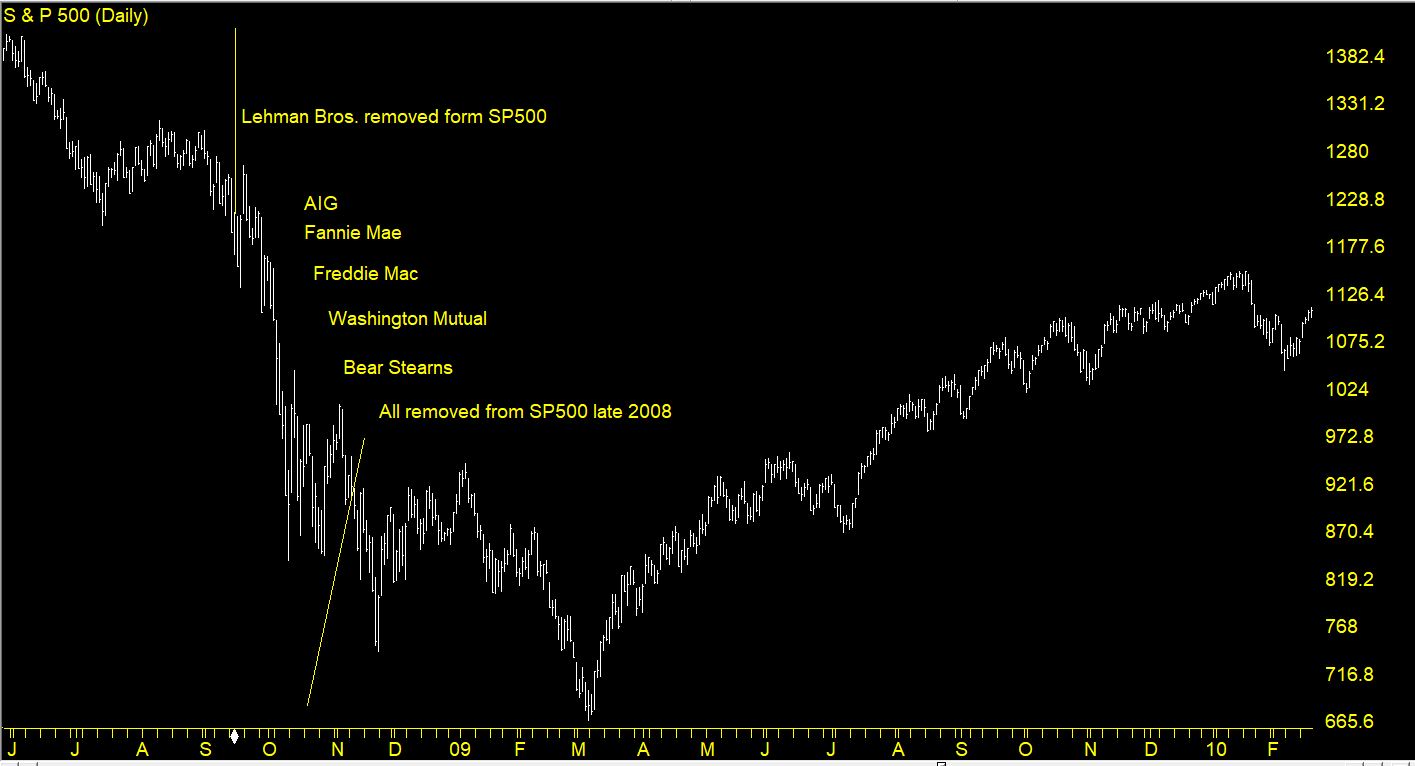
The SP500 index with major stocks removed at the height of the financial crisis
Consider the S&P 500 in 2007. Back then, financial giants like Lehman Brothers, Bear Stearns, and Washington Mutual were all part of the index—until the financial crisis exposed their fragility. Those stocks went to zero, but the historical chart of the S&P 500 smooths over their collapse because new leaders like Amazon, Nvidia, and Tesla later replaced them. The result: the long-term S&P 500 chart looks like a steady upward march, when in reality, an investor in the 2007 version of the index would have faced far more volatility and permanent capital loss in certain holdings.
This explains why the index’s backward-looking return can feel disconnected from the lived experience of investors who actually held the stocks in those earlier lineups.
The Russell 2000: Why It’s Barely Moved in 5 Years
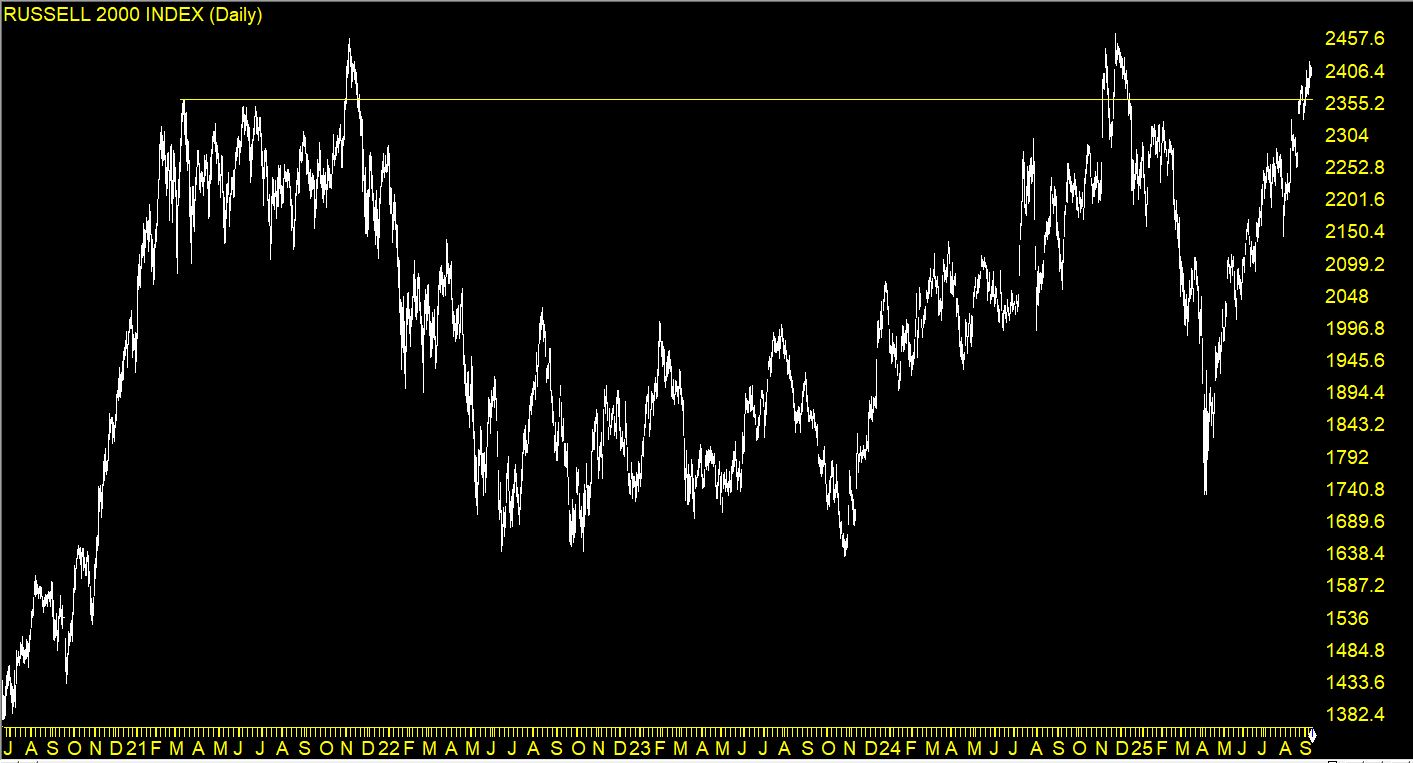
The Russell 200 chart from late 2020 to current
The Russell 2000 highlights survivorship bias in another way. Unlike the S&P 500, which rotates in stronger companies, the Russell is composed of small-cap stocks, many of which don’t survive or struggle to grow consistently.
Over the past five years, the Russell 2000 has barely moved, stuck in a sideways range, even while the S&P 500 has marched higher. Why? Because many small caps in the Russell 2000 face structural challenges—thin margins, high debt, vulnerability to rising interest rates—that prevent them from compounding like large-cap tech stocks. Although the Russell swaps out some names, the sheer number of struggling companies means the index reflects more of the “grind” of small-cap reality. Survivorship bias here doesn’t create the same illusion of strength—it highlights stagnation instead.
Why This Matters for Traders
Survivorship bias creates a dangerous blind spot: it makes past returns look better than what an investor might have achieved if they actually owned the index’s constituents at the time.
- For the S&P 500, it means that long-term performance charts hide the graveyard of failed companies. The winners dominate the narrative, but the losers were just as real for investors who held them.
- For the Russell 2000, it means traders need to be aware that many of its members are structurally weak, which can cap index-level returns despite occasional rallies.
How Traders Can Navigate Survivorship Bias
- Dig Into Index Components – Don’t just look at the headline number. Study which sectors and companies are driving the gains or stagnation.
- Use Equal-Weight Alternatives – The S&P 500 Equal Weight Index provides a different perspective, diluting the effect of mega-cap leaders and better reflecting the average stock’s performance.
- Blend With Sector/ETF Analysis – Instead of relying only on broad indices, drill down into sector ETFs or specific trading groups to uncover true leadership and laggards.
- Keep Survivorship in Mind – When backtesting or studying history, remember the S&P 500 of 2007 is not the same as today’s. Adjust your expectations accordingly.
Equal-Weighted vs Cap-Weighted Indices: Why the Difference Matters
Most traders are familiar with the standard S&P 500, but fewer realize it’s a market-cap weighted index. That means larger companies (like Apple, Microsoft, Nvidia, and Amazon) dominate its movements. A 5% swing in Apple carries far more weight than a 5% move in a mid-cap stock buried deep in the index. Over time, this weighting system concentrates returns in a handful of mega-cap leaders, amplifying the survivorship bias effect: the winners shape the chart, while the losers fade into irrelevance.
By contrast, the S&P 500 Equal Weight Index treats every company the same, regardless of size. Each stock counts for 0.2% of the index at rebalancing. This approach provides a more balanced view of how the average stock in the S&P is performing. During periods when mega-cap tech leads the market (like the last several years), the equal-weight index lags behind the cap-weighted S&P. But in broad-based rallies where many sectors participate, the equal-weight version often outperforms.
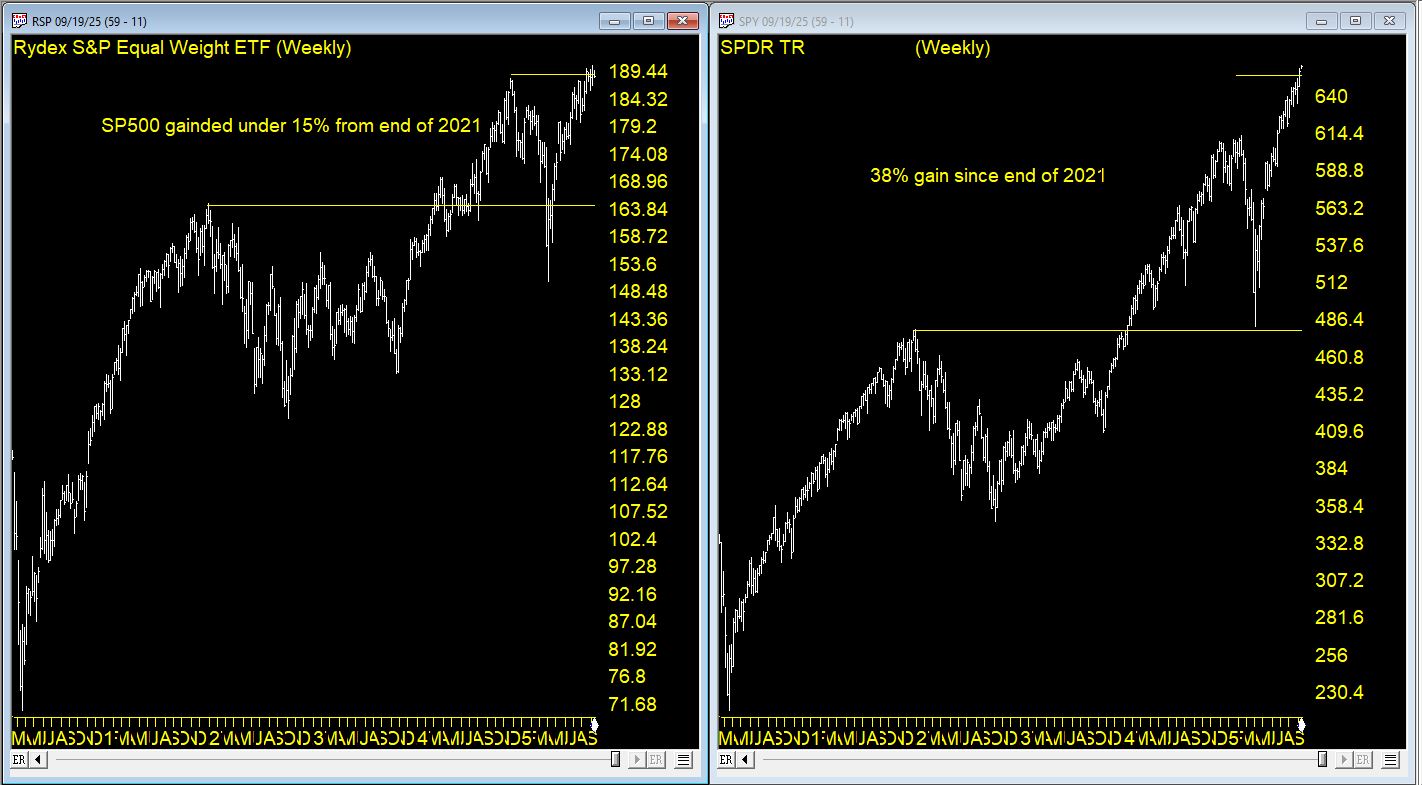
This chart compares the SPY ETF, a perfect surrogate for the SP500 index vs RSP, the Rydex SP500 Equal Weighted ETF. Total return for SPY from the end of 2021 was around 38%. For the RSP it was 15% for the same period.
Why This Matters for Traders
- Cap-Weighted Bias – The standard S&P 500 often hides the struggles of most companies because the top 5–10 stocks drive the majority of returns.
- Equal-Weight Reality Check – Equal weighting exposes whether the rally is broad or narrow. If the equal-weight index is flat while the cap-weighted index surges, it’s a sign that leadership is very concentrated.
- Practical Application – Traders can compare the two versions (SPX vs RSP) to gauge market health. A wide gap between them signals that survivorship bias and concentration are distorting the headline numbers.
Final Thoughts
Market indices are invaluable tools, but they aren’t perfect mirrors of reality. Survivorship bias smooths over failures, amplifies winners, and sometimes hides the real risks of buy-and-hold investing. By understanding how indices evolve—and by analyzing beneath the surface—traders can avoid being lulled into a false sense of security and make smarter, more grounded trading decisions.