Category Archives: Uncategorized

Your Friend, the Trend

2013 Market Year in Review   

The analysis is actually pretty simple:

Stocks:
Financial, World and Economic News: BAD
Stock Market Performance: GREAT!

Bonds:
Investor A: Hey, have you noticed that t-bond yields have hit a 15 month high? Investor B: What, me worry?

Gold:
Ppppppphhhhhhhhttttttt!

So it is pretty obvious at this point that stocks were the place to be in 2013 (which is maybe why the Investors Intelligence poll registers just 14% bears).   Of course, no one is ever content with that kernel of knowledge.  We want to know what’s going to happen in the future.  In fact the investing public is so hungry for “advance” knowledge that there are now thousands of pundits out there offering all kinds of wildly differing opinions.

So all the investor has to do is decide which opinion they “want to believe”, find a pundit offering that opinion, and “Voila” – they have “expert confirmation” that their opinion is “correct.”

And so it goes, and so it goes.

Meanwhile, back here in reality land, a simple trend-following approach can reap many benefits, especially when the following mantra is true for the stock market:

“If the Fed is pumpin’, the stock market’s jumpin’.”  Period.  End of analysis.
 
The Right Way and the Wrong Way to Look at Trend Following Methods
There is a right way and a wrong way to look at trend-following indicators:

The Wrong Way: “Wow, my handy dandy trend following indicator is bullish at the moment, therefore I can extrapolate this out to mean that this bullish trend will continue for some time to come.”

The Right Way: “Well, the trend is up at the moment, but of course this could change at any moment, so while I won’t panic and sell everything as long as the trend is still up, I will check back often and if the trend changes I will change my thinking and actions accordingly.”

The most important thing to remember about trend-following indicators is this:

-There is no “prediction” built into the current reading

In other words, a trend-following method does nothing more than identify the current trend right now.  Tomorrow is a different day.  While this may not “sound” as useful as some fancy indicator that portends to be able to predict the future, in reality it is actually much more useful.
Likewise, also remember that there is no humanly possible way to eliminate occasional whipsaws when using moving averages.  So learn to live with it.

Trend-Following Indicators I Have Known and, er, Followed(?)
None of the indicators or methods that I will discuss next will ever pick a bottom or a top.  In fact, they may not even really impress you in any way.  At least not until you find yourself on the sidelines while the market is powering higher without you on board.  So here are a couple of simple trend-following indicators to keep in mind:

The 200-day Moving Average
OK, this one is so basic and so commonly followed that it gets dismissed by some people.  But Figure 1 displays a variety of markets during different time frames.  In fact, an investor who simply fought the urge to fight the trend would have enjoyed riding some nice uptrends (particularly in the stock market) and avoided a lot of pain (most notably in bonds and gold). 

jotm20131210-01Figure 1 – Four Markets with 200-day simple moving average (Courtesy AIQ TradingExpert)

The Bowtie Pattern
I learned the Bowtie pattern from David Steckler (http://www.etfroundup.com/), who in turn learned it from David Landry (www.davelandry.com).  It involves three moving averages:

-10-day simple moving average
-20-day exponential moving average
-30-day exponential moving average

A Bullish signal occurs when the 10-day is above the 20-day and the 20-day is above the 30-day.
A Bearish signal occurs when the 10-day is below the 20-day and the 20-day is below the 30-day.
As usual, different traders use things in different ways.  David likes to enter as soon as a new trend emerges, I prefer to look for pullbacks within an established trend.  I suggest you explore both possibilities.

 20131210-02 Figure 2 – Four Markets with 10-day simple, and 20 and 30-day exponential averages (Courtesy AIQ TradingExpert)

The 13-55 Exponential Moving Average
OK, at some point one moving average method looks pretty much like every other moving average method.  In fact that is actually the case.  Linda Bradford Raschke of Market Wizards fame (www.LBRGroup.com) once stated (OK, for the record, I am paraphrasing here)  that “there is no one best moving average method, so just pick something and go with it.”

One more combination that I like as an intermediate term guide is the 13-day and 55-day exponential moving average combination as shown in Figure 3.

20131210-03 Figure 3 – Four Markets with 13-day and 55-day exponential averages (Courtesy AIQ TradingExpert)


Summary
I encourage you to take a closer look at all of the combinations I’ve mentioned above.  Remember two things:

-If you try to use them as Standalone systems (i.e., buying at every bullish signal and selling at every bearish signal) you are likely to be disappointed.
-The real power comes from using methods like the ones I’ve shown to objectively identify the current major trend, and then figuring out ways to trade in line with the major trend.

Jay Kaeppel

Chief Market Analyst at JayOnTheMarkets.com and AIQ TradingExpert Pro (http://www.aiq.com) client
 
Jay has published four books on futures, option and stock trading. He was Head Trader for a CTA from 1995 through 2003. As a computer programmer, he co-developed trading software that was voted “Best Option Trading System” six consecutive years by readers of Technical Analysis of Stocks and Commodities magazine. A featured speaker and instructor at live and on-line trading seminars, he has authored over 30 articles in Technical Analysis of Stocks and Commodities magazine, Active Trader magazine, Futures & Options magazine and on-line at www.Investopedia.com.

17 stocks have had positive returns in the last 20 trading days of the year, 8 years in a row.

Seasonality is always on a traders radar in December. The Santa Claus rally and all.

In this seasonal vein, I ran a scan of a decent database of liquid stocks with the following idea in mind.

1) The percentage return for the last 20 trading days of the year.
2) Look back the last 8 years
3) Only show me stocks that have either all positive or all negative returns in those 8 years

As the Santa Claus rally is a seasonal feature of the markets it made
sense to me to find stocks that do the same thing. Might as well get as
many odds in my favor as I can.

So here’s what I found.

17 stocks have had positive returns in the last 20 trading days of the year, 8 years in a row.

The top performer was AAR Corp – symbol AIR. It’s average return over
the last 8 years was a whopping 13.98%. Pretty impressive for 20 days.
More impressive was the consistency. The range of returns was between 7%
and 23%, so no 98% wild card distorting the pattern.

Of course there’s never any guarantee this will continue, but it’s impressive to see.

AIQ TradingExpert Pro’s Expert Design Studio was used to create the scan. FREE trial at
http://aiqsystems.com/PLSbrochure2.htm

Gettin’ Stupid In Gold Stocks(?)

A long time ago I evolved into something of a “go with the flow” kind of guy – at least when it comes to the financial markets.  Sure, in my youth I spent a fair amount of time staring into my crystal ball and trying to “pick tops and bottoms with uncanny accuracy.”  Unfortunately, it took me a long time to figure out that my crystal ball was not actually functioning.

So I have long understood the benefit of simply using some objective method to define the trend is either “up” or “down”, and just kind of seeing where it leads.  This approach came in pretty handy in 2013 when the “news” was essentially uniformly bad from start to finish.  But did the stock market care – oh contraire!

Updating the old adage “Don’t Fight the Fed” into today’s jargon:

“If the Fed is pumpin’, the stock market’s jumpin’. ”

And at the moment, there appears to be no end in sight (at least regarding QE2IB, or “Quantitative Easing to Infinity and Beyond”). So why do I all of a sudden have a foolish hankering to buy gold stocks?  This makes no sense at all.  In Figure 1 you see four different gold stock related investment vehicles.  Can you say “well established downtrend?”  Sure, I knew you could.  Some have broken down to new lows others are still holding out hope of establishing a double bottom.  And for some inexplicable reason, I feel this urge to play the long side. 

jotm1128-01Figure 1 – Gold Stock Double Bottom; In the Making or Wishful Thinking? (Courtesy AIQ TradingExpert)

The key hesitation here is the simple fact that on the approximately last 57 times it “looked” like a potential bottom in gold stocks…….it wasn’t.  Will this time around be any different?  Probably not.  Still……….in the immortal words of Glenn Frey, “the lure of easy money, it’s got a very strong appeal.”

 To Give In Or To Fight the Urge?

Investing and trading is a game best played by establishing certain rules (for example, “go with the trend”, “cut your losses”, etc.) and then sticking to them.  But human nature is, well let’s be blunt here, a pain in the butt.  The urge to “pick a bottom” is one of the stronger, more compelling urges that any trader feels. What a coup if you pull it off (which of course you probably won’t)!
So here is the question?  If you feel the urge to “pick a bottom”, should you:

a) Fight the urge in every case?
b) Give into the urge and bet the ranch?
c) Give into the urge and risk a small, acceptable amount of capital?

If you picked answer, b) my frank advice is to let someone else handle your money.
If you picked answer a), more power to you and I greatly respect your discipline.
If you picked answer c) yo, what up dog!?  (Sorry, I inadvertently walked in on some video my kids were watching)

I personally can live with answer c).  For a couple of reasons.  First of let’s establish the fact that choosing answer c will probably lead to your losing money more often than not.  Sorry, that’s just the reality.  However, it can also serve as something of a “release valve”, whereby the occasional small mistake reminds us not to make a big huge mistake (i.e., answer b, somewhere down the line)
So let take a look at one possibility.

Finding a Trade (for better or worse)

I used www.OptionsAnalysis.com to look for long call trades on tickers GDX, GDXJ, XAU, NEM and GG.  Sorting for Bullish percent to double and then among the top trades chose the one with the highest Gamma (long story short, high gamma in my book equals more “bang for the buck”)
The trade I came up with was buying the GDX January14 22 call at $1.06 as shown in Figures 2 and 3.

So is this a good idea?  In all candor, probably not.  But let me just explain what I am looking at.
Let’s say I am a trader with a $25,000 trading account and are willing to risk (throw away?) 2% of our trading capital on a foolhardy attempt to pick a bottom (hey, it’s my account, I can do what I want).

This means I can risk $500 ($25K x .02).  So if the option trades at $1.06, this means I can buy up to 4 contracts and risk $424.

jotm1128-02Figure 2 – GDX Call Trade (Courtesy: www.Optionsanalysis.com)
jotm1128-03Figure 3 – GDX Call Trade Risk Curves (Courtesy: www.Optionsanalysis.com)

So what are the likely (or at least possible) outcomes?

#1) Murphy’s Law being what it is, if I take this trade gold stocks will almost certainly continue to sink.  In this case the worst case scenario is that I hold the calls until January expiration and lose $424.

#2) if somehow, the market gods smile, let’s assume that GDX bounces back up to its early November high near $24.70.  In this case, the trade will generate a profit of $660 to $880 or more, depending on how soon GDX bounces.

Summary

As a rule I would never advocate for someone else to “pick a bottom”.  But let’s face, every once in awhile, the urge strikes.   So if you decide to give into the urge, make sure:

a) You don’t risk very much money.
b) You have enough upside potential to at least make it worth your while to do something that you may well look back upon and say, “Why the heck did I do that?”

As long as you employ a) and b) above, I view it as sort of a win-win situation (depending of course on how you define “win”).

If the underlying security in question does bounce to higher ground, you have the opportunity to generate a nice profit.

On the other hand, if the underlying security continues its current trend, you are served a powerful reminder of why you don’t try very often to “pick tops and bottoms with uncanny accuracy.”

So the bottom line is this: I am NOT telling you that I think gold stocks are about to bounce and that you should buy gold stocks (or options on gold stocks).  What I am telling you is that sometimes the urge to speculate will rise to the surface.

When that urge strikes there is a right way and a wrong way to react.

Jay Kaeppel

Chief Market Analyst at JayOnTheMarkets.com and AIQ TradingExpert Pro (http://aiq.com) client
 
Jay has published four books
on futures, option and stock trading. He was Head Trader for a CTA from
1995 through 2003. As a computer programmer, he co-developed trading
software that was voted “Best Option Trading System” six consecutive
years by readers of Technical Analysis of Stocks and Commodities
magazine. A featured speaker and instructor at live and on-line trading
seminars, he has authored over 30 articles in Technical Analysis of
Stocks and Commodities magazine, Active Trader magazine, Futures &
Options magazine and on-line at www.Investopedia.com.
Swing Trading With Three Indicators

The AIQ code based on Donald Pendergast’s article in the December 2013 issue of Stocks & Commodities, “Swing Trading With Three Indicators,” is provided at the following website: www.TradersEdgeSystems.com/traderstips.htm.

In addition to coding the author’s system as described in his article — which uses the following rules: buy to enter long and sell to exit the longs; short to enter shorts and cover to exit shorts — I created a second system that uses average true range
to get the breakout amount. I also added some additional trend filters
that use the NASDAQ 100 index.

All trading was simulated using closing
prices to determine whether an entry/exit had occurred, and then the
trades are entered/exited the next day at the open. My modified system
uses rules to “BuyATR,” “SellATR,” “ShortATR,” and “CoverATR.” A
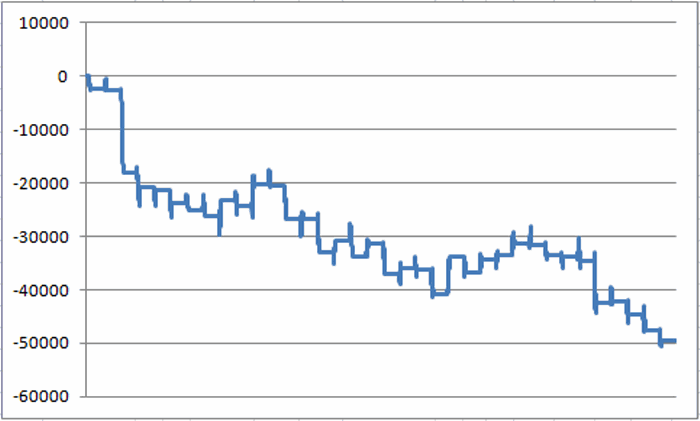
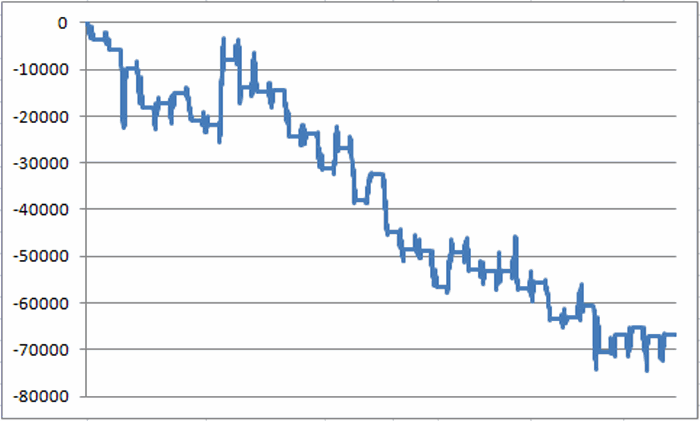
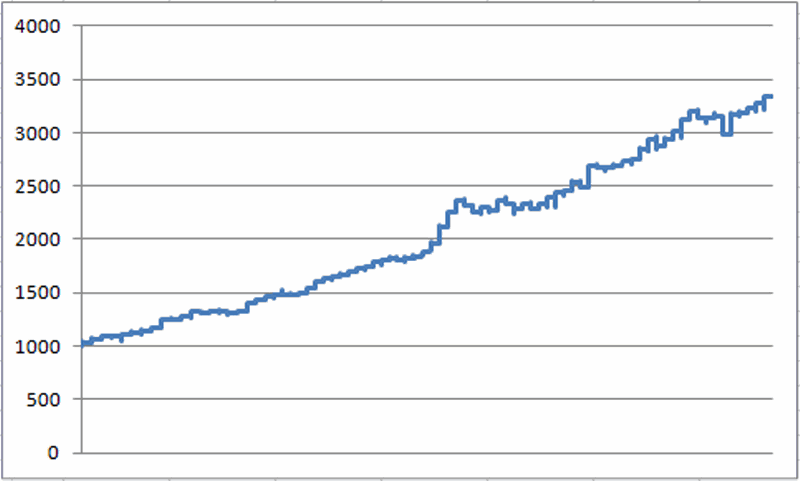
comparison of equity curves is shown in Figure 7. In testing the short
side, neither the author’s original system nor my modified system was
able to produce profitable results, although my modified system has a
smaller total loss than the author’s original system.

Image 1

FIGURE 7: AIQ, EQUITY CURVE. Here is a comparison of the equity curves
for Donald Pendergast’s original system and my modified system trading
the NASDAQ 100 list of stocks for the period 1/5/2000 to 10/9/2013.

The code and EDS file can be downloaded from www.TradersEdgeSystems.com/traderstips.htm.

!SWING TRADING WITH THREE INDICATORS
!Author: Donald Pendergast, TASC December 2013
!Coded by: Richard Denning 10/10/2013
!www.TradersEdgeSystems.com
!INPUTS:
emaLen is 50.
smaLen is 5.
breakAmt is 0.05.
atrLen is 10.
atrMult is 0.04.
H is [high].
L is [low].
C is [close].
C1 is valresult(C,1).
price is C.
emaLenLT is 200.
!UDFs:
maH is simpleavg(H,smaLen).
maL is simpleavg(L,smaLen).
ema is expavg(C,emaLen).
emaLT is expavg(C,emaLenLT).
TR is Max(H - L,max(abs(C1 - L),abs(C1- H))). 
ATR is simpleavg(TR,atrLen).
ATRpct is simpleavg(TR/C,atrLen).
ndxC is tickerUDF("NDX",C).
emaNDX is tickerUDF("NDX",ema).
emaNDXlt is tickerUDF("NDX",emaLT).
!SYSTEM RULES:
!Author's system:
Buy if price > maH+breakAmt and C > ema.
Sell if price < maL.
Short if price < maL-breakAmt and C < ema.
Cover if price > maH.
!Modified system using average true range:
BuyATR if price > maH+atrMult*ATR and C > ema and ndxC < emaNDX and ndxC > emaNDXlt .
SellATR if price < maL-atrMult*ATR.
ShortATR if price < maL-atrMult*ATR and C < ema and ndxC > emaNDX. 
CoverATR if price > maH+atrMult*ATR.
—Richard Denning
info@TradersEdgeSystems.com
for AIQ Systems

Finding Exceptional Opportunities with ETFs, Options, & Seasonal Trends

AIQ Opening bell contributor and TradingExpert Pro client, jay Kaeppel has a FREE webinar in association with the Market Technicians Association. details are below

On Wednesday, November 20th, 2013, the MTA’s Educational Web Series continues with another free educational webcast event at 12 PM Eastern / 9 AM Pacific. This week, we will feature…

“Finding Exceptional Opportunities with ETFs, Options, & Seasonal Trends”
with Jay Kaeppel

With all of the trading vehicles and great opportunities now available, there has never been a better time to be a trader.  The key to success is to identify and take advantage of exceptional opportunities.  In this fast-paced session, market veteran and author Jay Kaeppel reveals a handful of unique trading methods that you have likely never considered.  Each method details a simple, objective and highly effective plan of action.  Take a journey off the beaten path and discover simple trading strategies designed to succeed in the long run.

You can access the event at http://go.mta.org/lobby112013 

the link howver will not be live until 11/20/2013