Wow, does Murphy hate my guts, or what?
So I write an article all about how the stock market gets all bullish during the middle 18 months of the decade (September 30th – Mark Your Calendar) – i.e., starting at the close on September 30th of the mid-term election year – and what does Murphy go and do? He (She? Hmmm, that might explain a few things) invokes his (her?) dreaded Law and the market gets hammered right out of the box in early October.
Fortunately for me I have made enough mistakes in the market over the years that I don’t even bother to feel stupid anymore when things go exactly the opposite of what I might have anticipated. This leads me to invoke a maxim I adopted (after a long, painful process) a long time ago:
Jay’s Trading Maxim #412: Murphy hates you. Plan accordingly.
To put it into other terms, it essential for any trader or investor to give some thought as to what might go wrong before taking any particular action and to come up with an answer to the following question:
“What is my worst case scenario and what specific action will I take to mitigate the damage should this scenario unfold?”
Sounds like such an obvious question to ask and answer doesn’t it? But here is another question that will likely make a lot of readers squirm:
“Do you have an answer to the question above? Every time you make a trade?”
OK granted that’s two questions, but you get my drift.
Where to From Here?
So here is the part of the article where most “highly trained professional market analysts” tell you why the market is almost certain to rise (or fall) from here. Unfortunately, the bad news for me is that I am not very good at predicting the future (plus let’s face it, I can’t risk pissing Murphy off again). So while it “feels” like the market could melt down at any moment, I have little choice but to simply follow my plan and give the bullish case the benefit of the doubt. So two things to note:
#1. October through December in Mid-Term Election Years
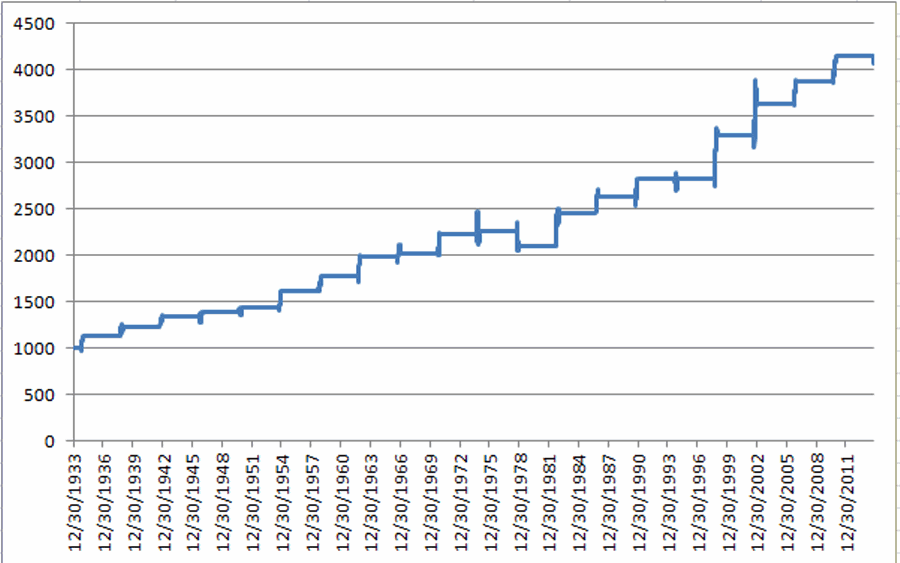
In Figure 1 you can see the growth of $1,000 invested in the Dow Jones Industrials Average only during the months of October, November and December during mid-term election years, starting in 1934 (i.e., 1934, 1938, 1942, etc.)
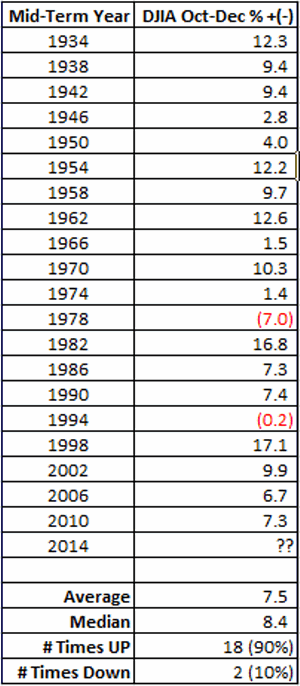
Figure 2 shows the year-by-year results
As you can see, this period has showed a gain 90% of the time. Granted a few were pretty miniscule, still the median gain was in excess of 8% and the worst previous performance was -7%.
#2. Short-Term Oversold
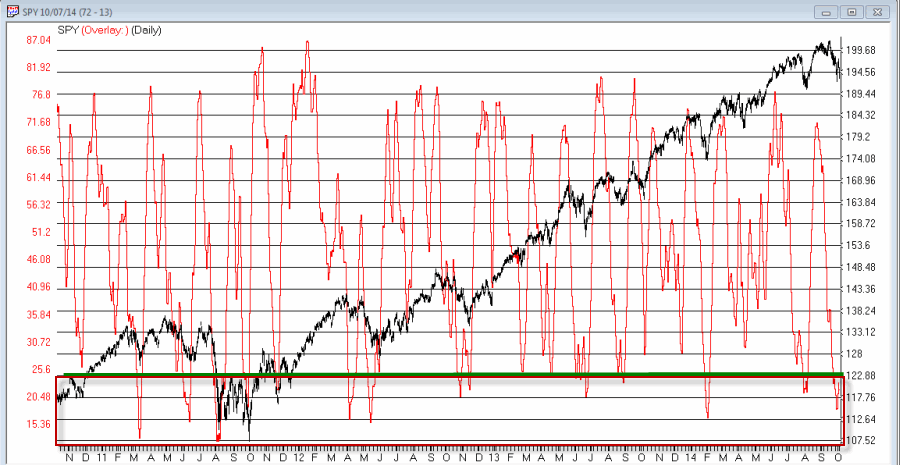
Well I could hardly refer to myself as a highly trained professional market analyst if I didn’t have my own proprietary overbought/oversold indicator, so, voila, surprise, surprise, my own proprietary overbought/oversold indicator (cleverly named JKOBOS) appears in Figure 3.
 Figure 3 – Jay’s Overbought/Oversold Indicator is flashing an oversold (i.e., theoretically bullish) signal at the moment (Chart courtesy of AIQ TradingExpert)
A close look at the chart in Figure 3 reveals that JKOBOS readings below 25 tend to highlight decent buying opportunities. With the indicator presently standing at 21.8, this qualifies as at least a “bullish alert”.
Summary
So is the combination of a bullish seasonal trend (i.e., October through December of Mid-Term election years) and an oversold market (based on a reading from my own overbought/oversold indicator) telling us that another rally is in the near future?
The honest answer is “not necessarily”. The optimistic answer however, is that despite the fear and loathing that seems to permeate the market these day (or maybe partly because of it), there is a chance that the market could surprise to the upside. As a dutiful trend follower I personally have little choice but to continue to give the bullish case the benefit of the doubt
Just don’t anyone tell Murphy I said that………sssshhhh!
Jay Kaeppel
Chief Market Analyst at JayOnTheMarkets.com and AIQ TradingExpert Pro (http://www.aiq.com) client
http://jayonthemarkets.com/


