In the first part Steve Hill, CEO of AIQ Systems covered Leveraging Candlestick Patterns for Predictive Stock Analysis. Candlestick patterns are a fundamental aspect of technical analysis that provides valuable insights into market sentiment and potential price movements.
Steve integrated volume analysis with candlestick patterns to improve signal reliability. The effectiveness of volume and additional exiting criteria are shared below this video.
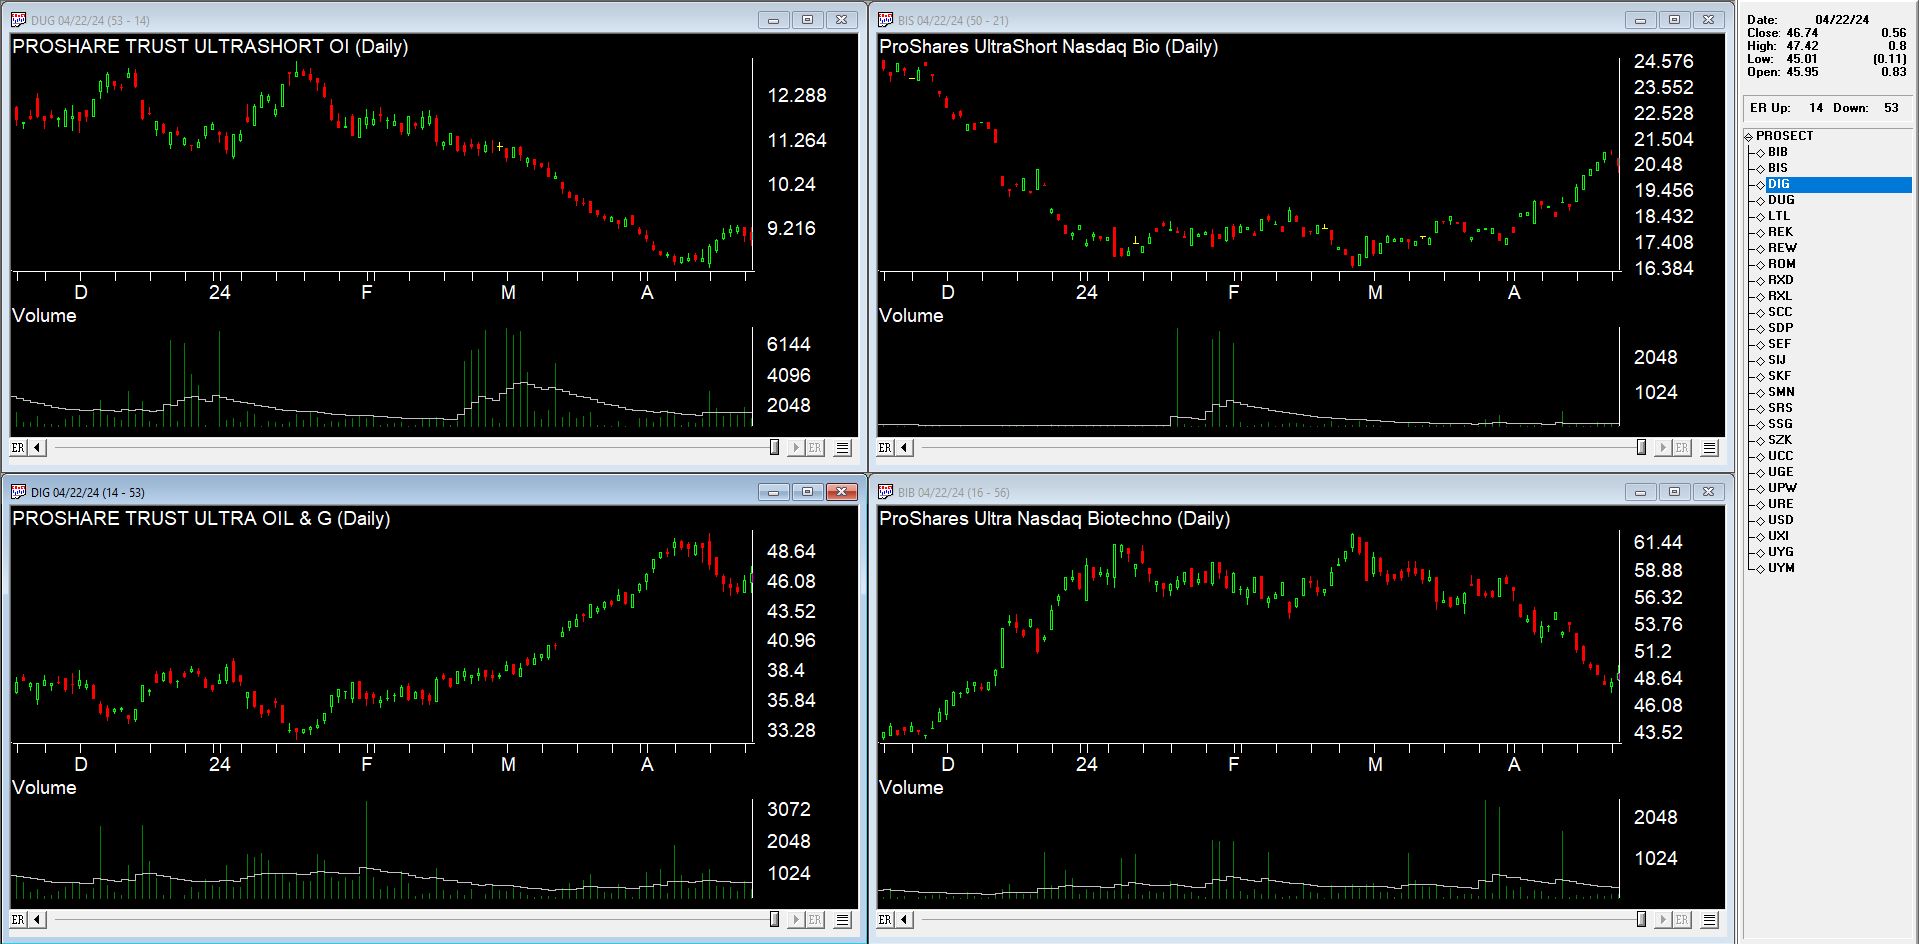
In the second segment, David Wozniak of TFRTrader covered his annual Summer Forecast, highlighting excellent-looking sectors and opportunities in the market.
David’s outstanding alert service provides text message buy and exit alerts. The current offer is 6-months of service at half price (charged monthly).
Visit https://aiqeducation.com/tfr-2/ for more details
During the Candlestick session, Steve began work on 4 different candle patterns with volume. the 2 patterns that eventually yielded good results are included in an EDS file below. Additional slope parameters were added to the strategy together with an MACD exit that he has continued working on.
To download the EDS and the 2 backtest files click here and unzip these files into your /wintes 32 folder. The EDS file contains the 2 bullish candle strategies and these backtests.
Bullish Engulfing Pattern with
- The 5-day slope is either modest down or up before the pattern.
- Volume on the day of the pattern must be 50% higher than the prior day.
- Exiting on MACD turns down and protects 90% of the initial investment.
The backtest over the last 2 years on SP1500 yielded more losers than winners, but still outdid the market.

Bullish Hammer with
- The 5-day slope is either modest down or up before the pattern.
- Volume on the day of the pattern must be 50% higher than the prior day.
- Exiting on MACD turns down, protects 90% of profit above 5%, and protects 90% of the initial investment.
The backtest over the last 2 years on SP1500 yielded more winners than losers, and outdid the market. Varying exit days on the MACD yields varying results. Current MACD exits if MACD turns down after 7 days in a position.