Tuesday our intraday snapshot revealed groups were strong still, but the Expert System showed weakness in stocks – we can profit while markets are still open.
We downloaded the snapshot midway through the trading day, ran our reports and right off noticed the AI Expert Rating system on stocks showed far more down ratings than up. The groups were still strongly up.
This video shows what we saw mid morning 9-10-19
The fastest way to browse hundreds of charts end of day is back with a vengeance. AIQ TradingExpert Pro has always been known for its ability to browse hundreds of daily price charts at blizzard speeds (one of the many unique features in the platform).
The fastest way to browse hundreds of charts end of day is back with a vengeance. AIQ TradingExpert Pro has always been known for its ability to browse hundreds of daily price charts at blizzard speeds (one of the many unique features in the platform).
Also includes historical data on US and Canadian stocks updated every night and Mutual Fund NAVs updated each night.
How do traders use this powerful data?
For the Chart Pattern Recognition traders this is the Ferrari of analysis tools. It’s simple to scan hundreds of charts to see the patterns emerging the same day it’s happening.
For traders who look for groups or sectors on the move, our intraday snapshot updates AIQ’s powerful groups and sectors too, so you can get ahead of a move in the market segments before the rest of the crowd.
For traders who want to place trades in the last hour of the trading day, downloading a snapshot in the last hour of trading day has almost the entire days action for your stocks, you can do your end of day analyze and place tomorrows trades today.
PLUS all the powerful features of AIQ TradingExpert Pro end of day including
AI-based Signals Uncover Hidden Trades – Award winning AI-based expert system screens for trading candidates that may have been missed by other systems, giving you an edge.
Time Saving Analysis with Chart Barometer – Our Indicator Barometer gives you an instant evaluation of the status of all indicators for each chart. Saving you time and allowing an easy to read analysis of any ticker.
Every Chart your way with Custom Layouts – Whether you prefer price bar, candlestick, or point and figure charts, we’ve got them. Plus, TradingExpert Pro delivers all the trendline and drawing tools that you expect in a top end package, including Fibonacci Studies, Gann Fans, and Regression Lines.
Time Saving Power! 200 Screening Reports – TradingExpert Pro automatically performs millions of computations and delivers instant access to one and two-page reports highlighting trading candidates for stocks, indexes, mutual funds, groups and sectors and more. Want to find tickers in a trend? We got it. Relative strength? Upside and downside at your fingertips. Volume Spikes, Persistence of Money Flow, Price Gap, Point and Figure Breakouts and many many more……All generated each day automatically…
Building a Trading System just got a Whole lot Easier – TradingExpert Pro provides an amazing way to design, test, and automate virtually any trading idea. It’s called the Expert Design Studio and is considered by traders to be the best tool of its kind. That’s because it combines a point-and-click interactive trading library with state-of-the-art back testing and gives you the ability to produce custom screening reports. PLUS our Pre-built strategies have been fine-tuned by our analysts to produce outstanding results. They include Growth, Divergence, Short Selling, Day Trading, and Bottom Fishing models, to name just a few.
Complete Array of Analysis Tools – TradingExpert Pro’s Proven Market Timing “too good to ignore.” Introduced in 1986, AIQ’s market timing system called the Crash of ‘87 and has called all major market moves since. Its multi-indicator, rule-based approach for determining market direction is time proven.
AND TradingExpert Pro also includes:
Professional Level Portfolio Management
Matchmaking Correlation tools
Automate Your Winning Systems with Portfolio Simulation Tools
Also includes historical data on US and Canadian stocks updated every night and Mutual Fund NAVs updated each night.
When AIQ released StockExpert in 1987, the Expert Ratings were the foundation of the system. This release represented the first software product developed for personal computers that used Artificial Intelligence to signal equity movement. AIQ’s founder and knowledge engineer, Dr. J.D. Smith, chose to use expert system technology that was developed at Stanford University in the late 60’s. An expert system uses a knowledge based rule driven structure.
Dr. Smith tested hundreds of technical rules that had been published by respected analysts.Those rules that tested well were placed into a knowledge base of rules. Rules were weighted based on their effectiveness. When a series of bullish rules was triggered, an Expert Rating buy signal was generated. A series of bearish rules generated an Expert Rating sell signal.
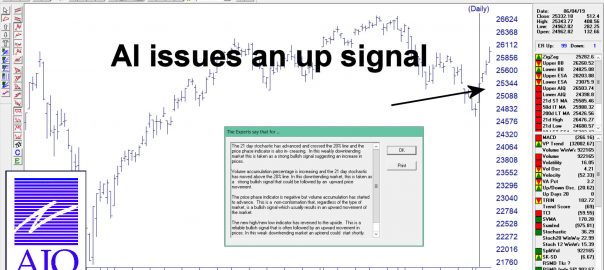
In this video Steve Hill explains the internal rules of the Expert System that generated the signal
The sell signal that the AI system issued on April 18, 2019 presaged a 2000 point move down. Things have now changed. On June 4, 2019 the AI system issued a buy signal.
The major stock indexes fell about 5% in May and rebounded most of the loss in June so far in one week. Source: CNBC.com
CURRENT EVENTS INFLUENCING MARKET MOVEMENT:
Stocks fell because of the Chinese and the 5% Mexican tariff announcement. There will probably be a positive announcement on the Mexican tariff front as tariffs will hurt our economy and the auto industry. In a positive development, Fed officials said they would be open to reducing interest rates if the tariffs weaken the economy. The current interest rate on the ten-year bond has dropped from 3.2% on the ten-year bond to about 2.10% now just in roughly six months. The affordability of buying a new house has gotten much better.
Trump will do what he can to shore up the economy, and if the markets fall, he is keenly aware of stemming any significant decline in the stock market as he wants to be reelected. The jobs report was a little weaker than was expected; that is why the Fed may reduce interest rates to keep the economy on an upward trajectory consistent with a 2-3% per year growth in the GDP. Overall, I am still positive on the economy unless full tariffs are enacted on the Mexican and the Chinese economies.
If they are expanded to the 25% fully enacted, I will be getting more cautious on the economy and the stock markets.
INTEREST RATE SCENARIO
The Federal funds rate is about 50 basis points or half of 1% higher than the two and five year Treasury Notes and has historically indicated that a recession is looming. The next few months will indicate whether the economy will soften. At this point, I don’t think it will decline as much as to go into recession, but there are still risks. Trump will determine what will happen to the economy. If the tariff situation is resolved, then I think the economy will still be in a growth phase, but if the tariffs are not resolved and get worse, the risks of a recession will increase dramatically.
MARKET RECAP:
Last month on my May 5th Bartometer I said that if the S&P 500 closes below 2,886 I will get VERY CAUTIOUS and It did. After that, it proceeded to 2,740 a drop OF 5%, AND my computer models gave a BUY signal ON 6/5/19, the big up day at 2,800, and it rallied to an intraday high of 2,885.85 and closed at 2875. Even though we are on the BUY-HOLD signal, I would like the S&P 500 to break out of 2886, preferably the 2,893 level and stay there for 2 to 3 days for me to believe the rally can approach the old highs of 2,954. See the charts for an explanation.
Index Averages
Some of the INDEXES of the markets both equities and interest rates are below. The source is Morningstar.com up until June 7, 2019.
*Dow Jones +12.50% S&P 500 +15.60% NASDAQ Aggressive growth +17.50% I Shares Russell 2000 ETF (IWM) Small cap +12.97% International Index (MSCI – EAFE ex USA) +9.97% Moderate Mutual Fund +8.20% Investment Grade Bonds (AAA) +7.03% +2.64% High Yield Merrill Lynch High Yield Index +7.39% +4.26% Floating Rate Bond Index +4.90% +2.60% Fixed Bond Yields (10 year) +2.10% Yield 2.63%
The average Moderate Fund is up 8.2% this year fully invested as a 60% in stocks and 40% in bonds.
If interest rates are peaking and look to be flattening or declining over the next year then investment grade or multisector bonds technically might be better than floating rate bonds. But diversification is important.
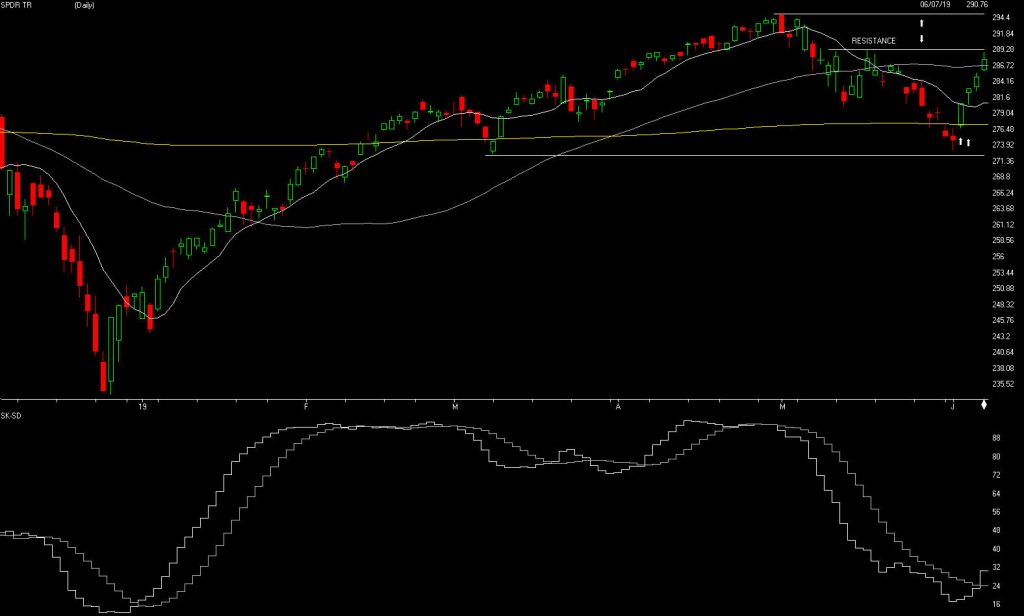
The S&P 500
Source: AIQ Systems
The S&P is above. Last month AIQ gave a SELL signal on April 18th but I went to a VERY CAUTIOUS the close below 2,886. The S&P dropped 5% after it closed below 2,886.
My models went to a BUY signal at 2,800 on 6/05/2019 the S&P now we are right back up to 2,875. Where do we go from here? If the 2,893 level can be broken on the Upside which I think it can and stay there for 2-3 days , then the S&P should approach its old high of 2,954 it hit on May 1, 2019. Notice the graph below the S&P. This chart is the SK-SD stochastics, it is breaking out on the upside and it shows the market is oversold and could continue to rally.
Source: Investopedia
*A Support or support level is the level at which buyers tend to purchase or into a stock or index. It refers to the stock share price that a company or index should hold and start to rise. When a price of the stock falls towards its support level, the support level holds and is confirmed, or the stock continues to decline, and the support level must change.
Support levels on the S&P 500 area are 2865, 2811, 2740, and 2683 areas. These might be BUY areas.
Support levels on the NASDAQ are 7704, 7414, 7291, and 7171.
On the Dow Jones support is at 25,943, 25739, 25,538 and 25,376. These may be safer areas to get into the equity markets on support levels slowly.
RESISTANCE LEVEL ON THE S&P 500 IS 2885. If there is a favorable tariff settlement, the market should rise short term.
THE BOTTOM LINE:
The S&P 500 is right at the point where it needs to break out of 2,893. I am still Moderately Bullish on the market and think it will break out. My computer technical models are on a short term buy signal, so do I think the S&P will breakout above 2,954, the old high it hit on May 1, 2019? We will see, but if it approaches that level, it will be imperative to watch the 2,954 level to see if it turns down. I will be watching that level to see if it is a breakout. If it cannot, then I would become Cautious again.
Best to all of you,
Joe Bartosiewicz, CFP® Investment Advisor Representative
5 Colby Way Avon, CT 06001 860-940-7020 or 860-404-0408
Contact information: SECURITIES AND ADVISORY SERVICES OFFERED THROUGH SAGE POINT FINANCIAL INC., MEMBER FINRA/SIPC, AND SEC-REGISTERED INVESTMENT ADVISOR.
Charts provided by AIQ Systems:
Technical Analysis is based on a study of historical price movements and past trend patterns. There is no assurance that these market changes or trends can or will be duplicated shortly. It logically follows that historical precedent does not guarantee future results. Conclusions expressed in the Technical Analysis section are personal opinions: and may not be construed as recommendations to buy or sell anything.
Disclaimer: The views expressed are not necessarily the view of Sage Point Financial, Inc. and should not be interpreted directly or indirectly as an offer to buy or sell any securities mentioned herein. Securities and Advisory services offered through Sage Point Financial Inc., Member FINRA/SIPC, and SEC-registered investment advisor. Past performance cannot guarantee future results. Investing involves risk, including the potential loss of principal. No investment strategy can guarantee a profit or protect against loss in periods of declining values. Please note that individual situations can vary. Therefore, the information presented in this letter should only be relied upon when coordinated with individual professional advice. *There is no guarantee that a diversified portfolio will outperform a non-diversified portfolio in any given market environment. No investment strategy, such as asset allocation, can guarantee a profit or protect against loss in periods of declining values. It is our goal to help investors by identifying changing market conditions. However, investors should be aware that no investment advisor can accurately predict all of the changes that may occur in the market. The price of commodities is subject to substantial price fluctuations of short periods and may be affected by unpredictable international monetary and political policies. The market for commodities is widely unregulated, and concentrated investing may lead to Sector investing may involve a greater degree of risk than investments with broader diversification. Indexes cannot be invested indirectly, are unmanaged, and do not incur management fees, costs, and expenses. Dow Jones Industrial Average: A weighted price average of 30 significant stocks traded on the New York Stock Exchange and the NASDAQ. S&P 500: The S&P 500 is an unmanaged indexed comprised of 500 widely held securities considered to be representative of the stock market in general. NASDAQ: the NASDAQ Composite Index is an unmanaged, market-weighted index of all over the counter common stocks traded on the National Association of Securities Dealers Automated Quotation System (IWM) I Shares Russell 2000 ETF: Which tracks the Russell 2000 index: which measures the performance of the small capitalization sector of the U.S. equity market. A Moderate Mutual Fund risk mutual has approximately 50-70% of its portfolio in different equities, from growth, income stocks, international and emerging markets stocks to 30-50% of its portfolio indifferent categories of bonds and cash. It seeks capital appreciation with a low to moderate level of current income. The Merrill Lynch High Yield Master Index: A broad-based measure of the performance of non-investment grade US Bonds MSCI EAFE: the MSCI EAFE Index (Morgan Stanley Capital International Europe, Australia, and Far East Index) is a widely recognized benchmark of non-US markets. It is an unmanaged index composed of a sample of companies’ representative of the market structure of 20 European and Pacific Basin countries and includes reinvestment of all dividends. Investment grade bond index: The S&P 500 Investment-grade corporate bond index, a sub-index of the S&P 500 Bond Index, seeks to measure the performance of the US corporate debt issued by constituents in the S&P 500 with an investment grade rating. The S&P 500 Bond index is designed to be a corporate-bond counterpart to the S&P 500, which is widely regarded as the best single gauge of large cap US equities. Floating Rate Bond Index is a rule-based, market-value weighted index engineered to measure the performance and characteristics of floating rate coupon U.S. Treasuries which have a maturity greater than 12 months.
The AI in TradingExpert Pro is programmed with the knowledge and insight of many stock market professionals, and is capable of making market recommendations based on this knowledge and insight; recommendations are made on a scientific basis free of bias, emotion, or hidden motives.
The AI or expert systems are programmed with rules that combine sound principles of technical analysis with the knowledge and experience of market professionals. Technical analysis, as used by AIQ, is based on the logic that price is the result of supply and demand. An AIQ timing signal, therefore, reflects all available knowledge and opinions such as news of the day, earnings, product reports, and company forecasts.
Technical analysis recognizes price and volume movement as the voice of the market itself and hence the only data necessary to determine what the market is likely to do next.
The AIQ Expert System
As an expert system, TradingExpert Pro is comprised of two knowledge bases – one for market timing and a second for stock selection – and an inference engine. Knowledge, in the form of rules, is stored in the knowledge bases. The inference engine is the thinking component of an expert system.
Each of the two knowledge bases within TradingExpert Pro has its own unique rules. The rules operate on facts which are values of the technical indicators. The indicators are computed from daily price, volume, and breadth data.
The rules employed in ATQ TradingExpert Pro are derived from the knowledge of many experts of market action and market timing. The reliability of these rules is maximized by combining them into a higher level of Expert Rules. Market analysts have found that no single rule or indicator works all the time. In AIQ, the Expert Rules and technical indicators work together to generate upside and downside signals.
Different knowledge bases for different market cycles
Continuing research at AIQ has shown that a single knowledge base can be improved if it is split into several knowledge bases, one for each phase of the market cycle. This advancement has been incorporated in the market timing knowledge base. The crest, trough, up slope, and down slope are each addressed by a specific set of rules specialized and weighted for that specific phase of the market cycle.
Each market day, then, the system determines the strength and direction of the phase, or trend. If there is no trend, it is first determined if the cycle is at a crest prior to a downtrend, or in a trough before the next uptrend. A more specialized knowledge base is used for each of these conditions, increasing the overall market timing effectiveness.
The inference engine
The knowledge base fuels the second part of the AIQ expert system, the inference engine. The inference engine is the thinking component of an expert system, and mimics the way humans think.
To understand how the AIQ inference engine works, picture a decision tree. The procedure starts from the tree’s trunk, where the major rules are located. Each rule is represented as a node, or fork, where the tree splits into three branches-representing a yes, a no, or a maybe. If the expert system determines that the premise of a rule is true, then the rule is considered to have fired, giving one of those three answers.
As each rule is evaluated, the process moves on to the next node and subsequent branches and continues to move on through the tree. Each rule node has an assigned value. That value is added to a node total that is accumulated as the inference engine passes through the tree. When all the rules have been evaluated, the resulting node total is normalized and becomes an AIQ Expert Rating.
Finally
The Expert Ratings are based on a scale of 0 to l00. The higher the Expert Rating, the stronger the signal. An Expert Rating of 95 or higher is considered a strong signal, meaning that there is a strong possibility that the price trend is about to change direction.
Confirmation of Expert Ratings
Research has shown that a change in direction of the Phase indicator (changing up for up ER, changing down for down ER) at or close to the high Expert Rating date provides a higher degree of confidence in the rating. Phase is not part of the Expert System.
So let us examine the last 7 weeks market action.
2-98 down signal 9/18/2018, 9/18/18 and 9/20/18 all with these primary riles firing confirmed by phase
Intraday high prices of the market have increased to a 21 day high. Never the less, the advance/decline oscillator is negative. This unusual event is read as a very strong bearish signal that is often followed by an downward price movement.
Closing prices on the market have increased to a 21 day high but market breadth as measured by advances and declines is declining. This non-confirmation in a trading market is a weak bearish signal indicating a possible downward price movement.
DJIA with the 3 successive down signals
Confirmed down signal 4-96 on 10/05/18 these primary rules fires
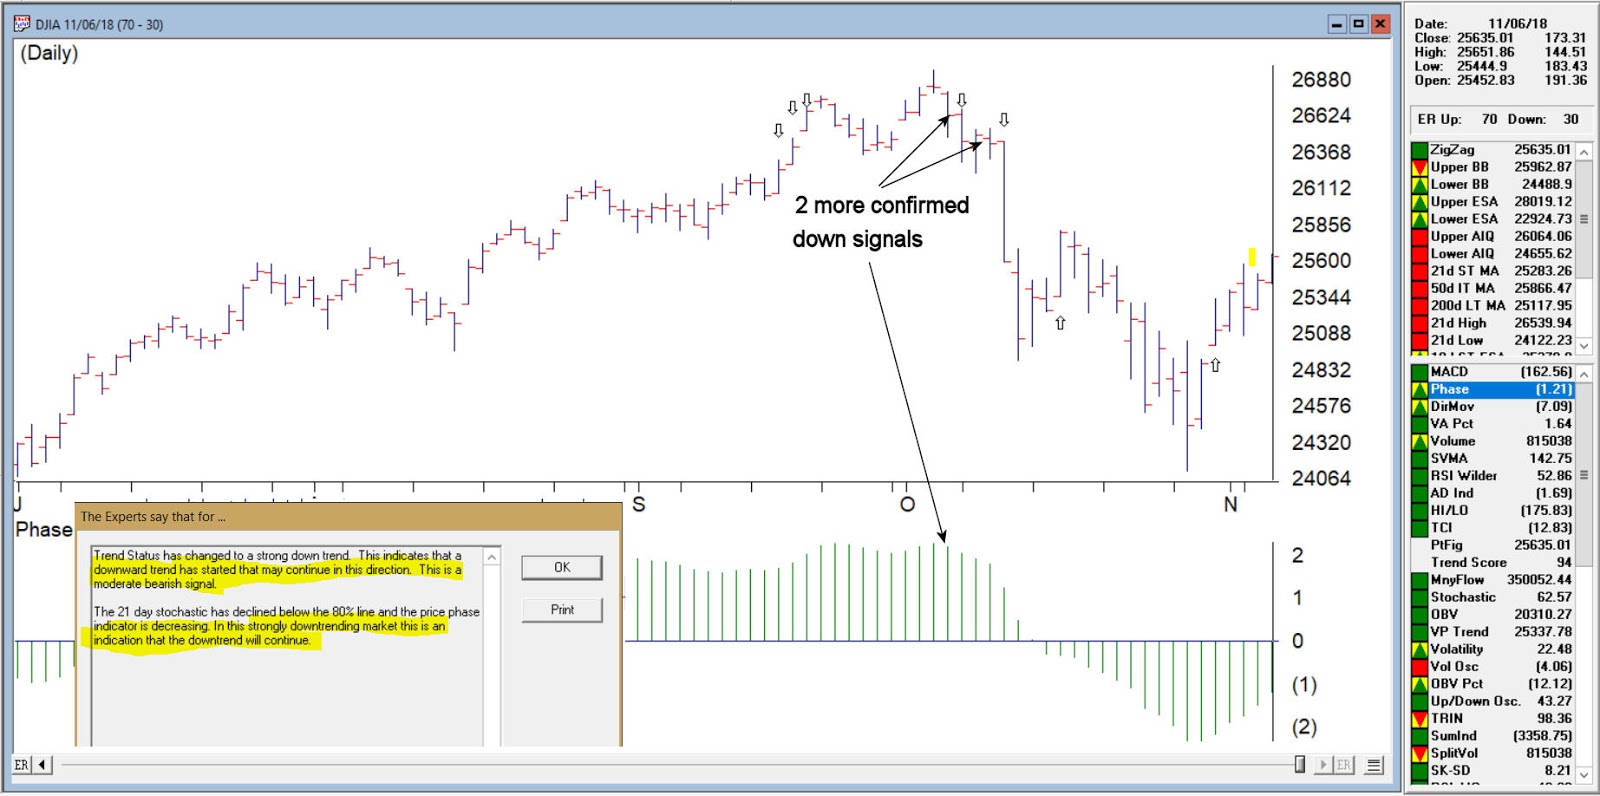
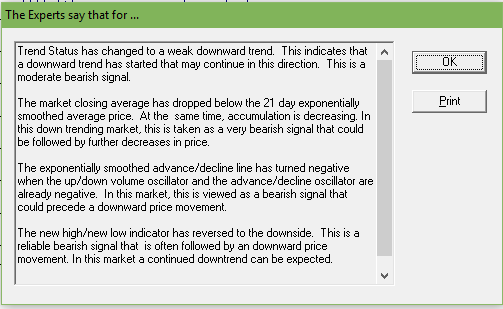
Trend Status has changed to a strong down trend. This indicates that a downward trend has started that may continue in this direction. This is a moderate bearish signal.
The 21 day stochastic has declined below the 80% line and the price phase indicator is decreasing. In this strongly downtrending market this is an indication that the downtrend will continue.
Confirmed down signal 5-95 on 10/18/2018 these primary rules fires
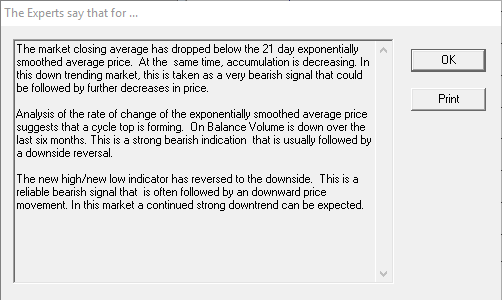
The market closing average has dropped below the 21 day exponentially smoothed average price. At the same time, accumulation is decreasing. In this down trending market, this is taken as a very bearish signal that could be followed by further decreases in price.
The price phase indicator is positive but volume distribution has started to advance. This is a nonconformation that, regardless of the type of market, is a bearish signal which usually results in an downward movement of the market.
DJIA with 2 more down signals confirmed by phase
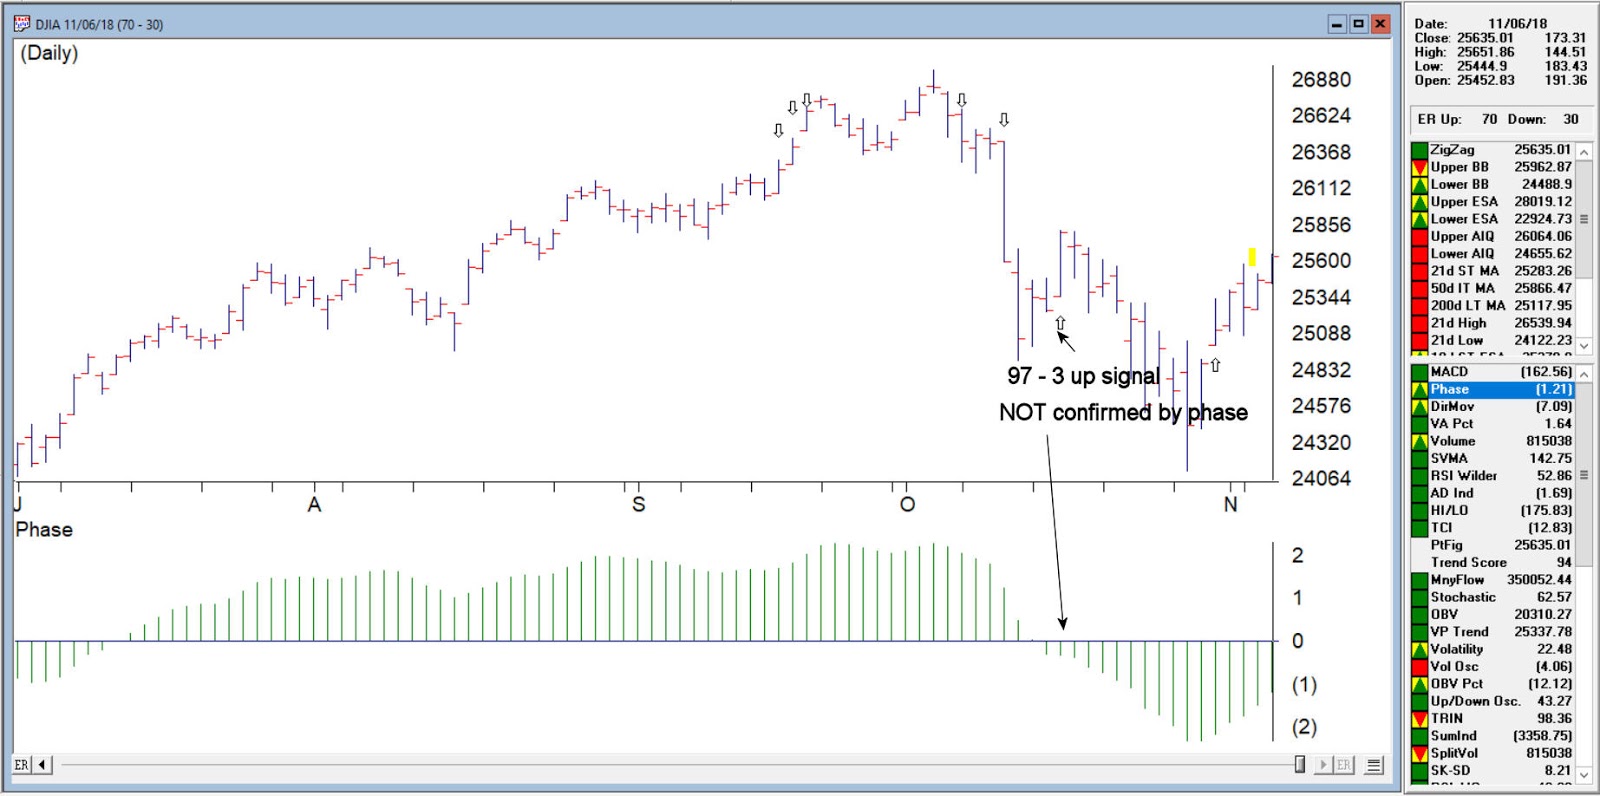
Unconfirmed up signal on 10/16/18 – phase did not change direction
Volume accumulation percentage is increasing and the 21 day stochastic has moved above the 20% line. In this downtrending market, this is taken as a strong bullish signal that could be followed by an upward price movement.
The price phase indicator is negative but volume accumulation has started to advance. This is a non-conformation that, regardless of the type of market, is a bullish signal which usually results in an upward movement of the market.
The new high/new low indicator has reversed to the upside. This is a reliable bullish signal that is often followed by an upward movement in prices. In this weak downtrending market an uptrend could start shortly.
DJIA on 10/16/18 97-3 up no phase confirmation
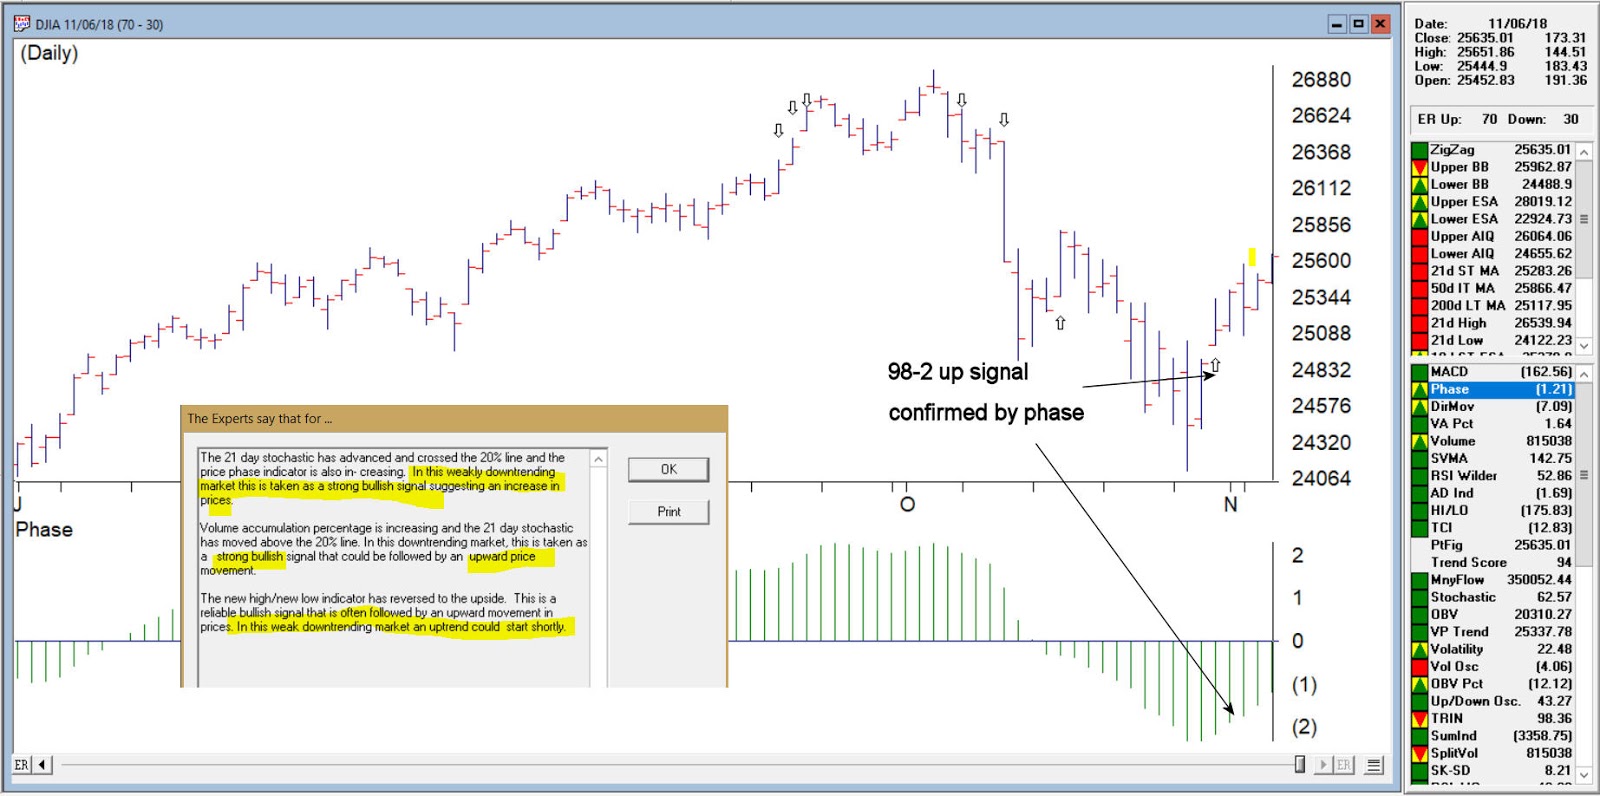
Confirmed up signal 10/31/18 98-2
The 21 day stochastic has advanced and crossed the 20% line and the price phase indicator is also in- creasing. In this weakly downtrending market this is taken as a strong bullish signal suggesting an increase in prices.
Volume accumulation percentage is increasing and the 21 day stochastic has moved above the 20% line. In this downtrending market, this is taken as a strong bullish signal that could be followed by an upward price movement.
The new high/new low indicator has reversed to the upside. This is a reliable bullish signal that is often followed by an upward movement in prices. In this weak downtrending market an uptrend could start shortly.
DJIA on 10/31/18 with confirmed up signal 98-2
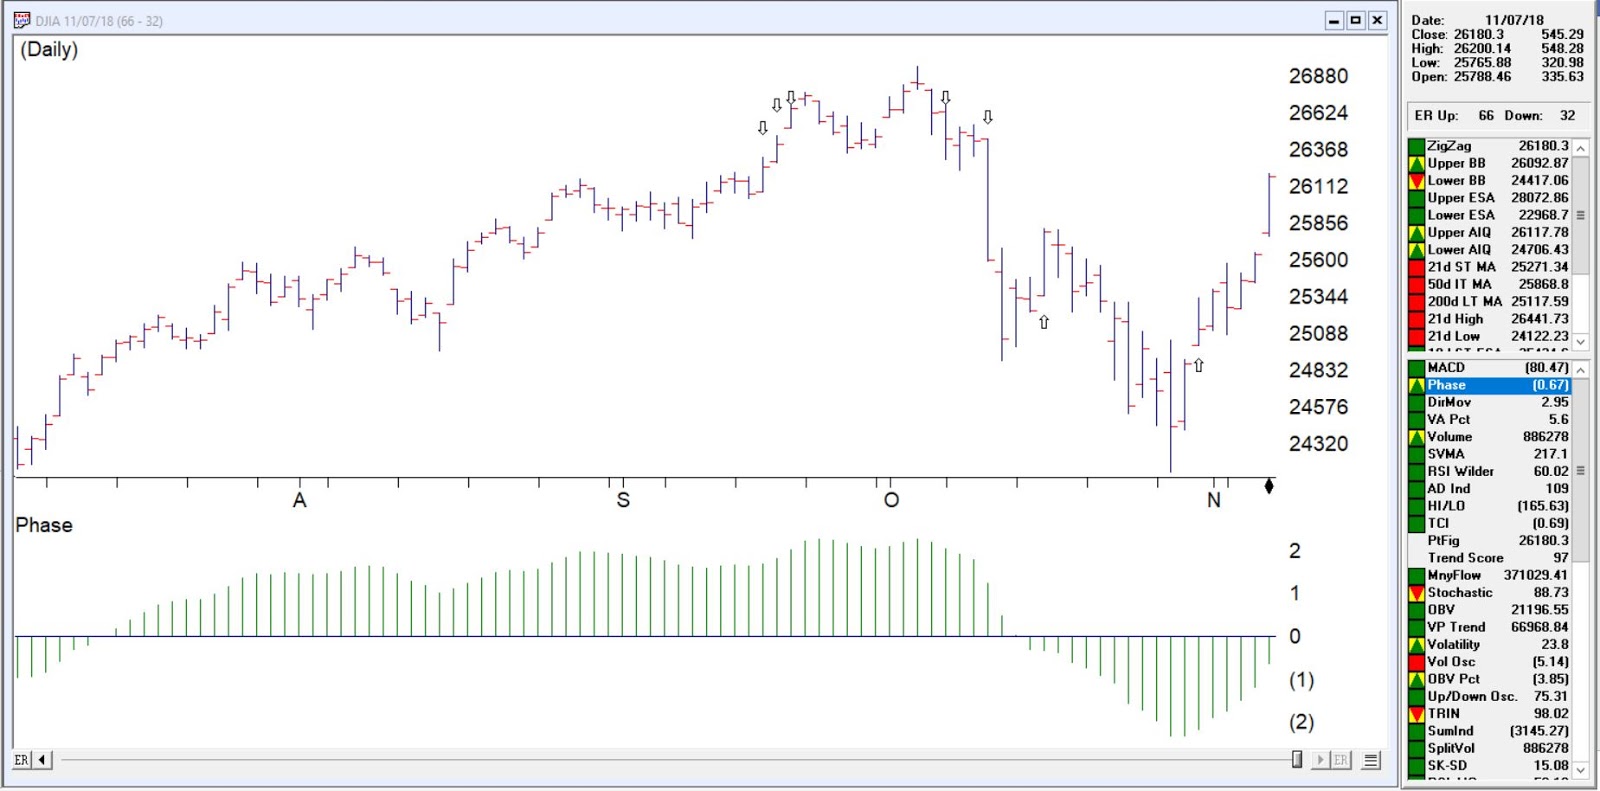
While never perfect, the Expert rating provides a formidable advantage to the trader looking for signs of direction changes in the market. As of 11/7/18 close the DJIA was at 26180
The AIQ TradingExpert Pro Market Timing Expert System uses over 400 rules based on numerous technical indicator conditions to determine if a change in the current trend is imminent. The signals can be quite early and confirmation from other indicators not used in the AI system, like Phase are recommended. Quick disclaimer, we are not advisors and do not give recommendations.
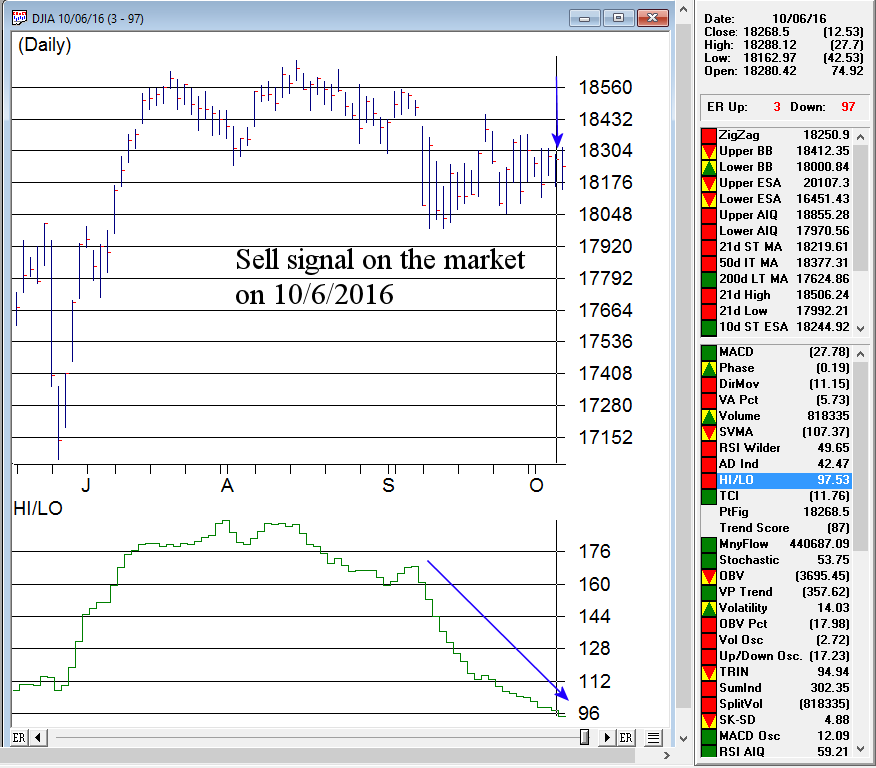
Here’s the signal from last week. The number of stocks with new highs vs new lows is clearly showing a persistent down trend, while the market has been flat.
By clicking the ER button in Charts we can see some of the major rules that have fired to generate the signal
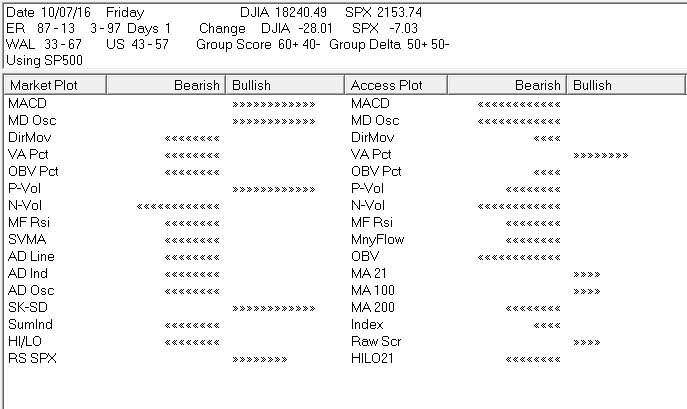
The AIQ market Log in Reports provides additional information that gives us some broader information on the market. here we can see how a broad range of indicators on the market are fairing and also the percentage of buy vs sell signals on stocks in the S & P 500 (Unconfirmed signals 43-57, confirmed signals 33-67) .
The market action from Tuesday generated a second down signal of 2-98, following the 200 point fall in the Dow. The major rules that fired this time are below.
While never perfect, we always take heed when this many rules are firing