Category Archives: ETFS

A Focus on the Trends in Stocks, Bonds and Gold

In the end it is not so much about “predicting” what will happen next in the financial markets, but rather recognizing – and being prepared for – the potential risks, that makes the most difference in the long run.  So let’s start by looking at current trends.
Stocks
Let’s start with a most simple trend-following model that works like this:
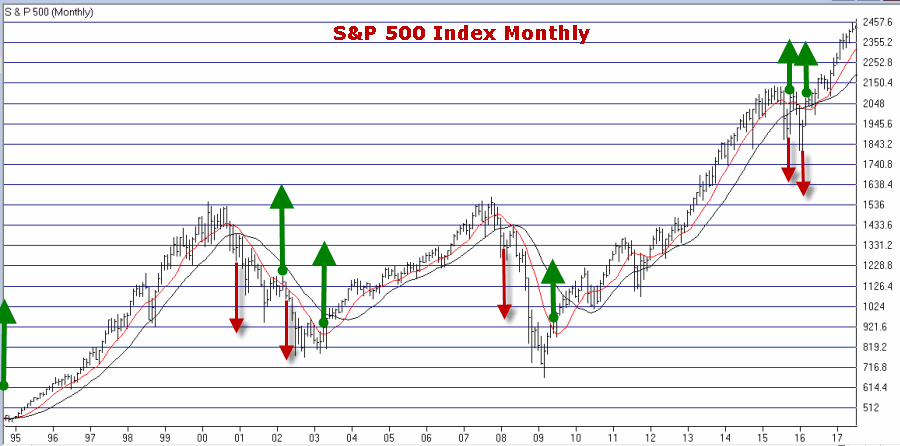
-A sell signal occurs when the S&P 500 Index (SPX) registers two consecutive monthly closes below its 21-month moving average
-After a sell signal, a buy signal occurs when SPX register a single monthly close above its 10-month moving average.
Figure 1 displays recent activity.
1
Figure 1 – SPX Trend-Following signals (Courtesy AIQ TradingExpert)
The good news is that this model does a good job of being out of stocks during long bear markets (1973-74, 2000-2002, 2008-2009).  The bad news is that – like any trend-following model – it gets “whipsawed” from time to time.  In fact the two most recent signals resulted in missing out on the October 2015 and March 2016 rallies.
But note the use of the phrase “simple trend-following model” and the lack of phrases such as “precision market timing” and “you can’t lose trading the stock market”, etc.
For now the trend is up.  A few things to keep an eye on appear in Figures 2 and 3.  Figure 2 displays four major averages.  Keep an eye to see if these averages break out to the upside (see here) or if they move sideways to lower.
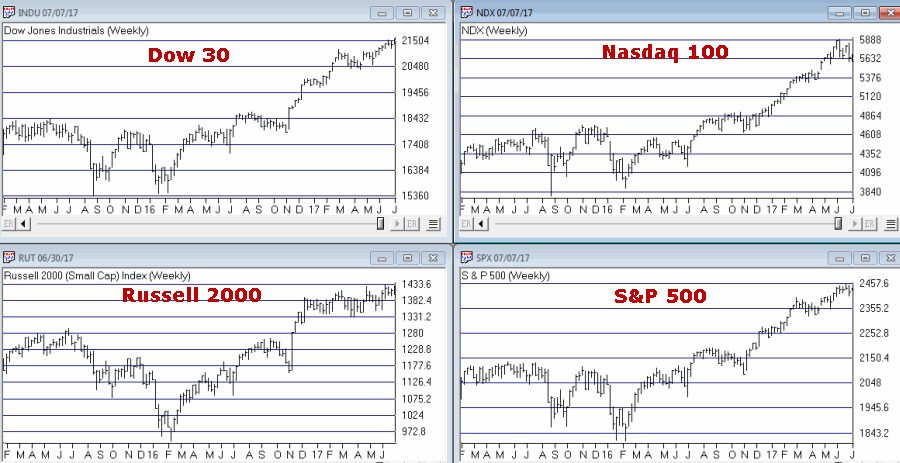
2Figure 2 – Four Major Market Averages (Courtesy AIQ TradingExpert)
In addition, I suggest following the 4 tickers in Figure 3 for potential “early warnings” – i.e., if the major averages hit new highs that are not confirmed by the majority of the tickers in Figure 3.3
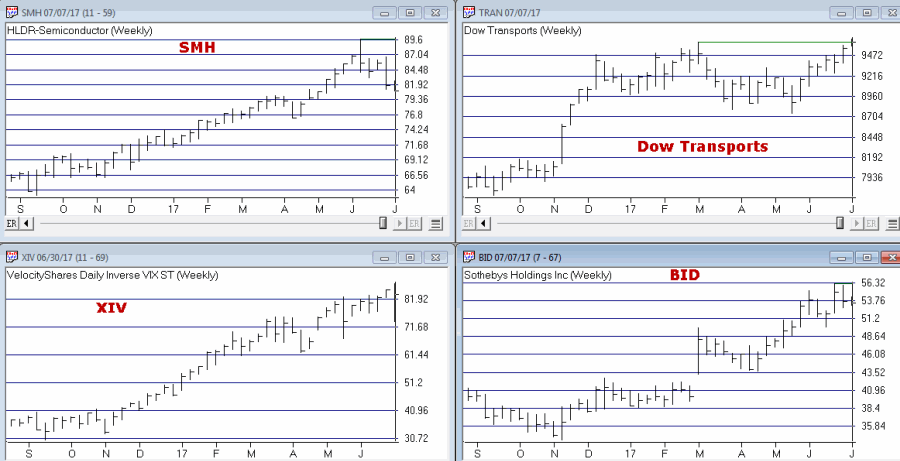
Figure 3 – Four potential “Early Warning” tickers  (Courtesy AIQ TradingExpert)
Bonds
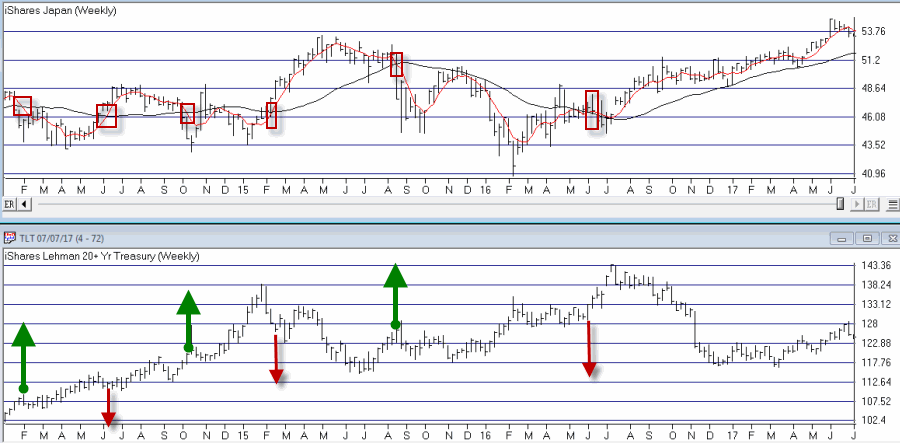
My main “simple bond trend-following model” remains bearish.  As you can see in Figure 4, a buy signal for bonds occurs when the 5-week moving average for ticker EWJ (Japanese stocks) drops below its 30-week moving average and vice versa.
4
Figure 4 – Ticker EWJ 5-week and 30-week moving average versus ticker TLT (Courtesy AIQ TradingExpert)
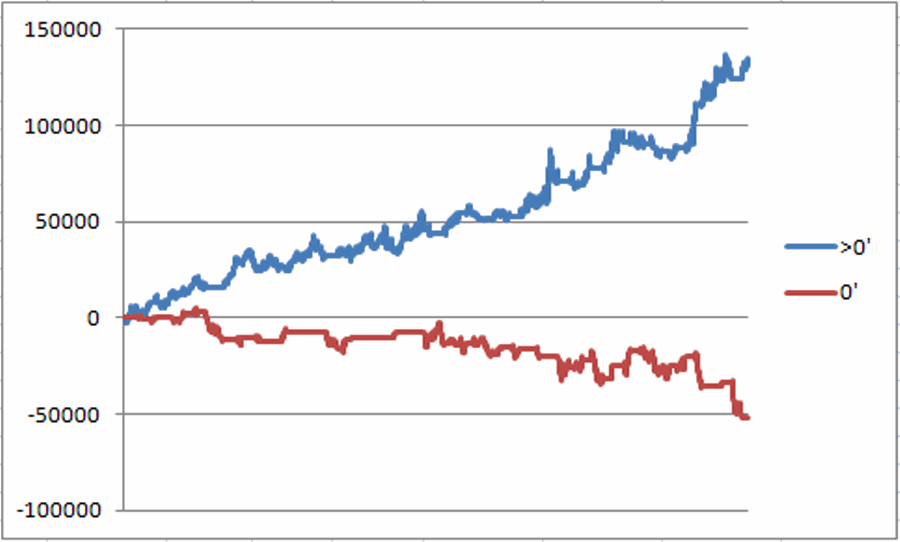
A 2nd model using metals to trade bonds has been bullish of late but is close to dropping back into bearish territory.  Figure 5 displays the P/L from holding a long position of 1 t-bond futures contract ONLY when both the EWJ AND Metals models are bearish (red line) versus when EITHER model is bullish (blue line)
5
Figure 5 – T-bond futures $ gain/loss when EWJ OR Metals Models are Bullish (blue line) versus when EWJ AND Metals Models are both Bearish (red line); August 1990-present
Gold
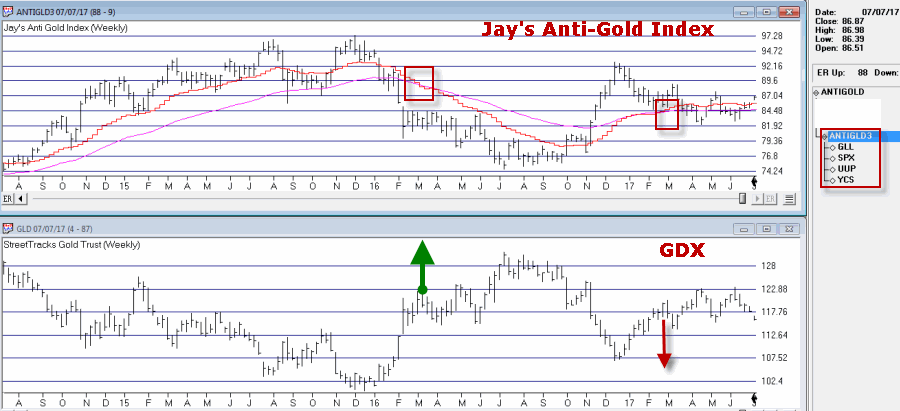
My most basic gold trend-following model is still bearish.  This model uses my “Anti-Gold Index” (comprised of tickers GLL, SPX, UUP and YCS).  It is bullish for gold when a Front-Weighted Moving Average (detailed here) is below the 55-week exponential moving average and vice versa.
6
Figure 6 – Jay’s “Anti-Gold Index” versus ticker GLD (Courtesy AIQ TradingExpert)
Summary
So at the moment the stock model is bullish and the bond and gold models are bearish.  Are these trends certain to persist ad infinitum into the future?  Definitely not.  Will the models detailed here provide timely signals regarding when to get in or out the next time around?  Sorry, but it doesn’t always work that way with trend-following.
But as for me I prefer “riding the trend” to “predicting the future.”
Some painful lessons just stick with you I guess.
Jay Kaeppel  Chief Market Analyst at JayOnTheMarkets.com and AIQ TradingExpert Pro (http://www.aiqsystems.com) client. 
Disclaimer:  The data presented herein were obtained from various third-party sources.  While I believe the data to be reliable, no representation is made as to, and no responsibility, warranty or liability is accepted for the accuracy or completeness of such information.  The information, opinions and ideas expressed herein are for informational and educational purposes only and do not constitute and should not be construed as investment advice, an advertisement or offering of investment advisory services, or an offer to sell or a solicitation to buy any security.
Summer Fun with Biotech and Real Estate

Studies suggest that buying an upside breakout can be a good strategy.  It sure can be scary though.  There is always that underlying fear of looking like “the last fool in” if the security in question experiences only a false breakout and then reverses back to the downside (and I hate it when that happens).  Still, for a stock to go from $50 to $100 it first has to go to $50.01, then $50.02, etc.
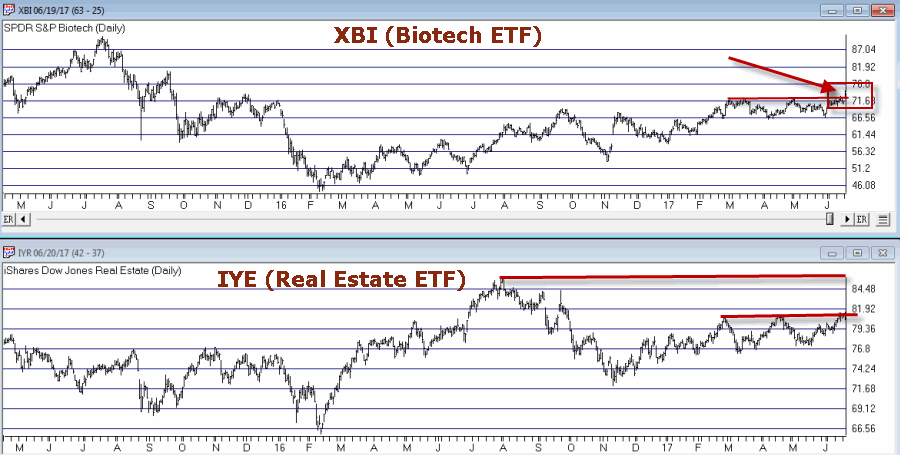
Buying into an impending breakout can be an even dicier proposition since this involves buying into what is essentially a “topping formation.”  I recently wrote about consolidation patterns in biotech and real estate.  These sectors appear to be getting closer to a resolution.  Consider tickers XBI (biotech ETF) and IYR (real estate ETF) as shown in Figure 1.
1Figure 1 – Biotech and Real Estate (Courtesy AIQ TradingExpert)
XBI appears to be breaking out to the upside – at least for now.  IYR is close to breaking out – however, one could look at it in an exactly opposite manner and claim that it is “running into resistance near the old highs and therefore may be forming a top.”
Ah, the eye of the beholder.
A Seasonal Play in Biotech and Real Estate
It is pretty widely known at this point that the summer months tend not to be very favorable for the stock market overall (although July of this year might be an exception to the rule).  But biotech and real estate often provide a summer trading opportunity.
The seasonally favorable period extends from:
*The close on June trading day #17 (6/23/2017 this year)
*Through the close on July trading day #21 (7/31/2017 this year)
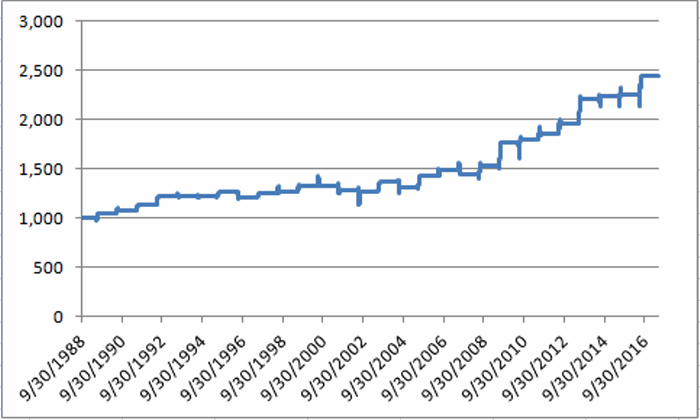
Figure 2 displays the growth of $1,000 split evenly between ticker FBIOX (Fidelity Select Biotech) and ticker FRESX (Fidleity Select Real Estate) every since 1989 during this period.
2Figure 2 – Growth of $1,000 split between FBIOX and FRESX during seasonally favorable summer period (1989-2016)
Figure 3 displays a summary of the results since 1989.
Measure Result
# Years UP 22 (79%)
# Years DOWN 6 (21%)
Average All Years +3.3%
Average UP Year +5.0%
Average DOWN Year (-2.9%)
Best UP Year +14.9% (2009)
Worst DOWN Year (-4.3%) (2004)
Figure 3 – Summary Results
One thing to  note is the lack of downside volatility despite the fact that both biotech and real estate can be quite volatile (worst down period was -4.3% in 2004).
Year-by-Year Results Appear in Figure 4.  For comparisons sake the annual performance for the Dow Jones Industrials Average (DJIA) during the same period is included.
  Year        FBIOX/FRESX    DJIA    Diff
1989 4.8 5.1 (0.3)
1990 2.8 2.1 0.7
1991 5.8 3.6 2.2
1992 7.0 3.2 3.7
1993 0.8 2.1 (1.3)
1994 (0.6) 1.8 (2.4)
1995 3.5 2.7 0.8
1996 (4.1) (4.1) 0.1
1997 2.9 6.4 (3.5)
1998 1.8 2.2 (0.5)
1999 4.4 (0.1) 4.5
2000 0.3 1.1 (0.8)
2001 (3.6) 0.1 (3.8)
2002 (1.5) (4.9) 3.4
2003 8.0 1.0 7.0
2004 (4.3) (2.9) (1.4)
2005 9.6 2.1 7.5
2006 4.0 1.8 2.2
2007 (3.2) (1.0) (2.1)
2008 6.7 (1.9) 8.6
2009 14.9 10.0 4.9
2010 2.0 1.6 0.4
2011 3.0 0.8 2.2
2012 5.7 4.0 1.7
2013 12.6 5.2 7.5
2014 1.1 0.4 0.7
2015 0.6 (2.2) 2.8
2016 8.6 2.3 6.2
Figure 4 – Annual Results for FBBIOX/FRESX during seasonally favorable  summer period versus Dow Jones Industrials Average
For the record,during the seasonally favorable summer period:
*The FBIOX/FRESX combo has outperformed the Dow in 19 out of 28 years.
*$1,000 invested in FBIOX/FRESX grew to $2,440
*$1,000 invested in the Dow Industrials grew to $1,505
Summary
So is biotech and real estate the place to be in the month ahead?  Well, that’s “the thing” about seasonal trends – there’s no way to know for sure what it’s going to be “this time around.”
On a cautionary note, it should be pointed out that the FBIOX/FRESX combo has registered a gain during the seasonal summer period – and outperformed the Dow – in each of the last 9 nine years.
So is it “Away We Go” or this the year that “Murphy’s Law” exacts its revenge?  As always, time will tell.
Jay Kaeppel  Chief Market Analyst at JayOnTheMarkets.com and AIQ TradingExpert Pro (http://www.aiqeducation.com) client. 
Disclaimer:  The data presented herein were obtained from various third-party sources.  While I believe the data to be reliable, no representation is made as to, and no responsibility, warranty or liability is accepted for the accuracy or completeness of such information.  The information, opinions and ideas expressed herein are for informational and educational purposes only and do not constitute and should not be construed as investment advice, an advertisement or offering of investment advisory services, or an offer to sell or a solicitation to buy any security.
This is What a Lack of Fear Looks Like (I Think)

I keep hearing that investors are “skittish” and “concerned” about the markets and the economy and so forth.  But the recent action in a relatively obscure ETF jumped out at me and seems to suggest that this is not necessarily the case – at least not among those who are active in the markets.  From what I can tell these people don’t have a care in the world.  See what you think.
What is Ticker SVXY?
A few key concepts:
*Implied volatility (IV) essentially measures the level of time premium built into the price of a given option or series of options on a given security.  In anxious times implied volatility will rise – sometimes sharply – as an increase in demand by speculators rushing to buy options to protect / hedge / speculate / etc in a given security, causes time premium to inflate.  When traders are less worried or more complacent then implied volatility will typically fall as decreased option buying pressure results in lower time premiums.
In sum, high and/or sharply rising IV typically signals fear, low and or declining IV typically signals a lack thereof.
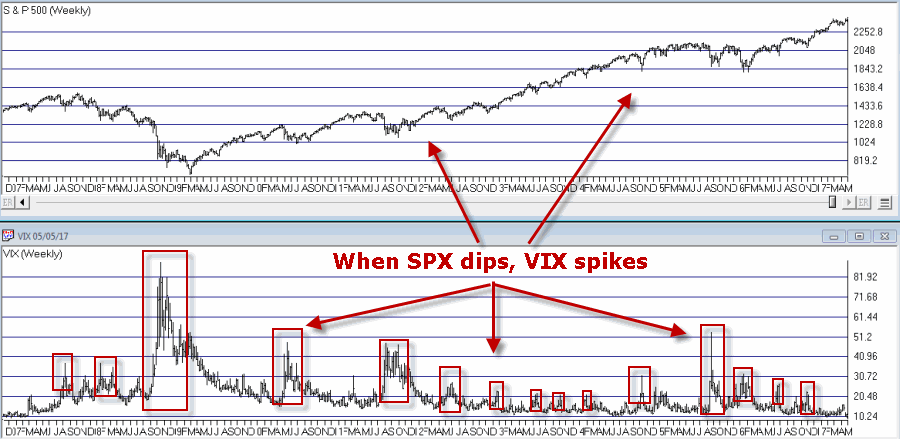
*The VIX Index (see Figure 1) measures the implied volatility of options for the S&P 500 Index traded at the CBOE.  Typically when the stock market declines – especially when it declines sharply – the VIX index tends to “spike” as fearful traders rush in and bid up S&P 500 Index option prices
1
Figure 1 – VIX Index (trading inversely to S&P 500 Index) (Courtesy AIQ TradingExpert)
*In essence, the VIX Index is “inversely correlated” to the stock market.
*Ticker SVXY is an ETF that is designed to track the “inverse” of the VIX Index.  In other words, when VIX rises, SVXY falls and vice versa.  This also means the following:
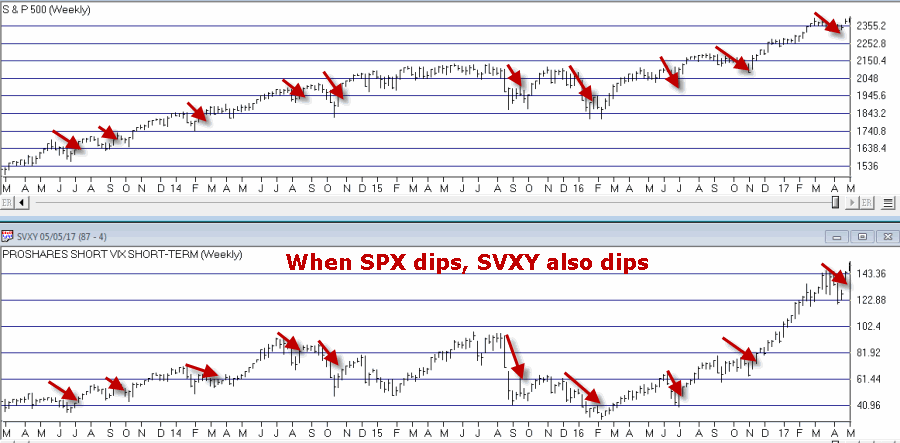
*Ticker SVXY is highly correlated to the SP 500 Index.  In other words, as the stock market moves higher SVXY typically also moves higher and vice versa.
2
Figure 2 – SVXY (movements are correlated to the S&P 500 index)(Courtesy AIQ TradingExpert)
In sum, a declining trend in the price of SVXY shares typically signals fear, while a rising trend in the price of SXVY typically signals a lack thereof.
Now to My Concern
Hopefully some of that made sense.  In a nutshell, the key takeaways are that when fear is low:
*SVXY rises
*Implied volatility declines
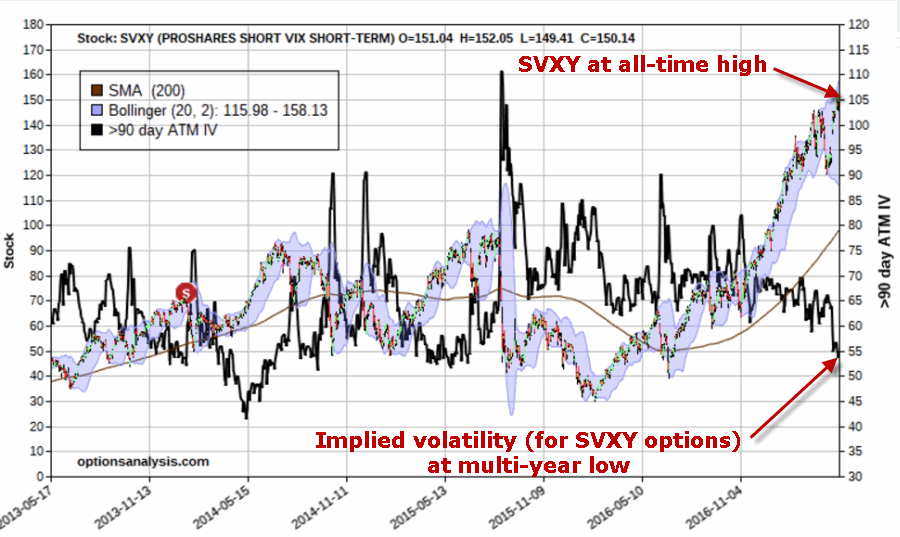
But what if both go to extremes?  Is that a bad thing?  The reason I ask appears in Figure 3. 3
Figure 3 – Ticker SVXY at an all-time high with implied volatility for options on ticker SVXY plunging (both pointing to a lack of fear)
As far as I can tell, this is what a lack of fear looks like:
*Ticker SVXY is rising dramatically
*Implied volatility (SVXY options) is plunging
In the last 4 years there has never been a bigger disparity between these two measures of “fear” – and they are both pointing to “no fear.”
Summary
So the obvious question now is – does any of this matter?  I mean this is more of a “perspective” indicator (“where we are now”) than a “timing’  indicator (“where we are headed next”).  I cannot presently point out a way to use this to generate specific buy and sell signals.
In addition, as a trend-follower I am not the type to make any “Aha, the End is Near” type pronouncements.  As long as the market wants to keep running higher I am happy to “go along for the ride.”
But the less I see my fellow riders being concerned about the market, the more concerned I become.
In the long run that instinct has served me well.
(Here’s hoping that my instinct is wrong this time)
Jay Kaeppel
Chief Market Analyst at JayOnTheMarkets.com and AIQ TradingExpert Pro (http://www.aiqsystems.com) client. http://jayonthemarkets.com/
Disclaimer:  The data presented herein were obtained from various third-party sources.  While I believe the data to be reliable, no representation is made as to, and no responsibility, warranty or liability is accepted for the accuracy or completeness of such information.  The information, opinions and ideas expressed herein are for informational and educational purposes only and do not constitute and should not be construed as investment advice, an advertisement or offering of investment advisory services, or an offer to sell or a solicitation to buy any security.
Four Things to Watch for Warning Signs

First things first: I am primarily a trend-follower (this is based on, a) the relative long-term benefits of following trends and b) my lack of ability to actually “predict” anything – but I digress).
As a trend-follower I love the fact that the stock market has been trending higher and the fact that there is so much “angst” regarding the “inevitable top.”  Still, like a lot of investors I try to spot “early warning signs” whenever possible.  Here are the four “things” I am following now for signs of trouble.
Fidelity Select Electronics
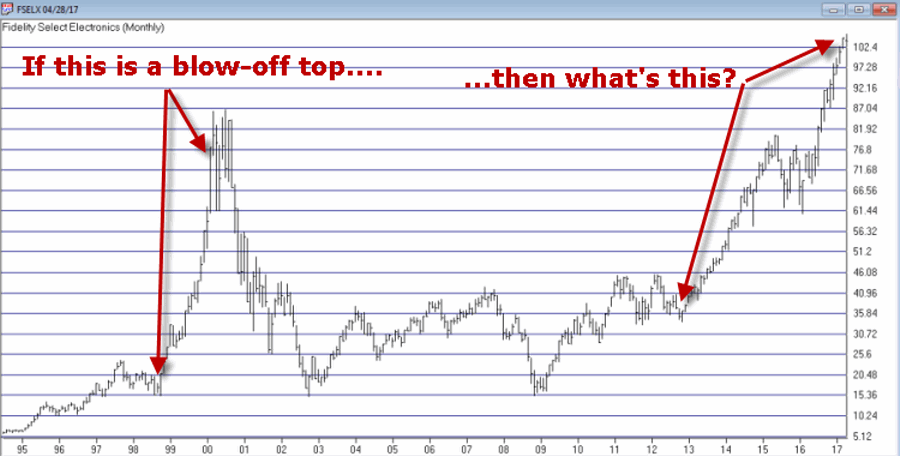
In Figure 1 you see, a) the blow-off top of 1999-2000 and b) today.  Are the two the same?  I guess only time will tell.  But the point is, I can’t help but think that if and when the bloom comes off of the electronics boom, overall trouble will follow.  Here is hoping that I am not as correct here as I was here.
1
Figure 1 – Ticker FSELX (Courtesy AIQ TradingExpert)
Just asking.
Transportation Index
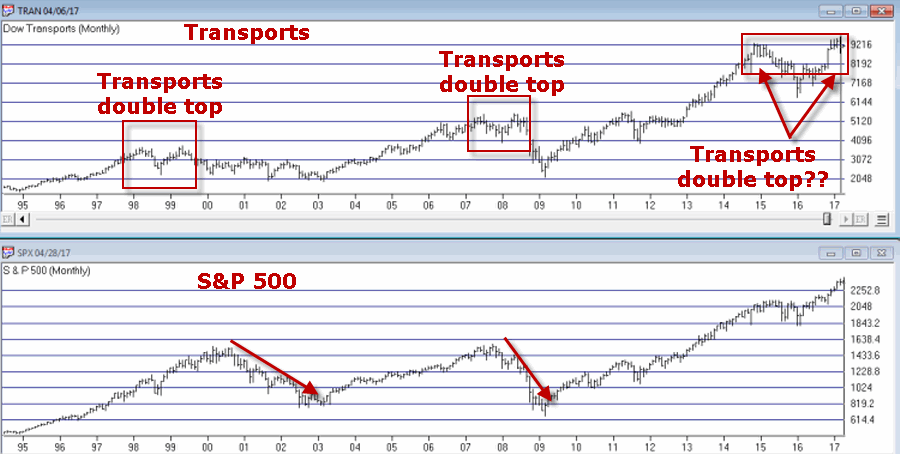
As you can see in Figure 2, the Dow Transports has a history of making double tops which is followed by trouble in the broader market.  Are we in the process of building another double top?  And will trouble follow if we are?  Dunno, hence the reason it is on my “Watch List” rather than on my “OH MY GOD SELL EVERYTHING NOW!!!!! List”.
2
Figure 2 – Dow Transportation Index (Courtesy AIQ TradingExpert)
I guess we’ll just have to wait and see.
Ticker XIV
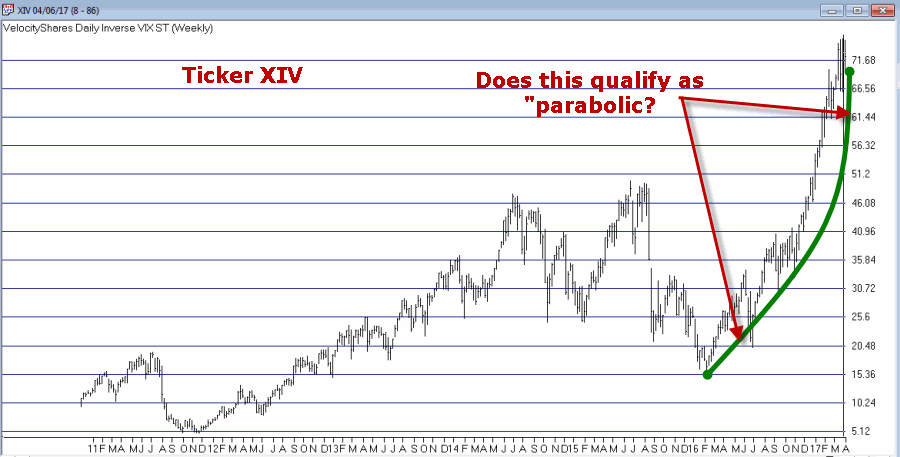
Ticker XIV is an ETF that is designed to track inverse the VIX Index. As a refresher, the VIX Index tends to “spike” higher when stocks fall sharply and to decline when stocks are rising and/or relatively quiet.  To put it in simpler terms, in a bull market ticker XIV will rise.  As you can see in Figure 3 one might argue that XIV has gone “parabolic”.  This is a potential warning sign (assuming you agree that the move is parabolic) as a parabolic price move for just about anything is almost invariably followed by, well, let’s just say, “not so pretty”.
3
Figure 3 – Ticker XIV (Courtesy AIQ TradingExpert)
Let’s hope not.  Because if it does qualify as  parabolic that’s a very bad sign.
Ticker BID
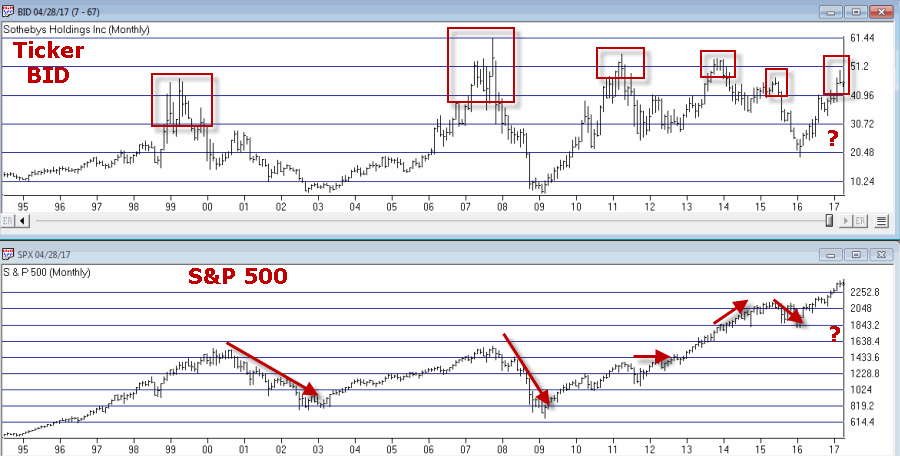
This one may or may not be relevant but for what it is worth, Sotheby’s (ticker BID) has on several occasions served as something of a “leading indicator” at stock market tops (for the record it has also given some false signals, so this one is more for perspective purposes rather than actual trading purposes). Still, if this one tops out in conjunction with any or all of the above, it would likely serve as a useful warning sign.
4
Figure 4 – Ticker BID (Courtesy AIQ TradingExpert)
Summary
There is no “urgent action” to be taken based on any of this.  Bottom line: Nothing in this article should trigger you to run for the exits.
Still, it might be wise to at least take a look around and “locate the exit nearest you.”
You know, just in case.
Chief Market Analyst at JayOnTheMarkets.com and AIQ TradingExpert Pro (Courtesy AIQ TradingExpert) client. http://jayonthemarkets.com/
Disclaimer:  The data presented herein were obtained from various third-party sources.  While I believe the data to be reliable, no representation is made as to, and no responsibility, warranty or liability is accepted for the accuracy or completeness of such information.  The information, opinions and ideas expressed herein are for informational and educational purposes only and do not constitute and should not be construed as investment advice, an advertisement or offering of investment advisory services, or an offer to sell or a solicitation to buy any security.
MatchMaking a seasonal Energy play

If you follow jay Kaeppel’s posts in this blog, you’ll know that he’s the master of research on all things seasonal. This past week he posted a seasonal article on energy using FSESX – Fidelity Select Energy Services. Previously he had noted the bullish tendency for ticker FSESX during the months of February, March and April.  In his follow up piece, he added one more “favorable” month and then also looked at a 6-month “unfavorable” period. The article is included at the end of this post so you can see the results.

As Mutual funds are not for everyone, we went in search of alternative tickers that could closely match FSESX in performance characteristics. Using AIQ Matchmaker we compared the price action of FSESX against our universe of stocks and ETFs looking for a match.

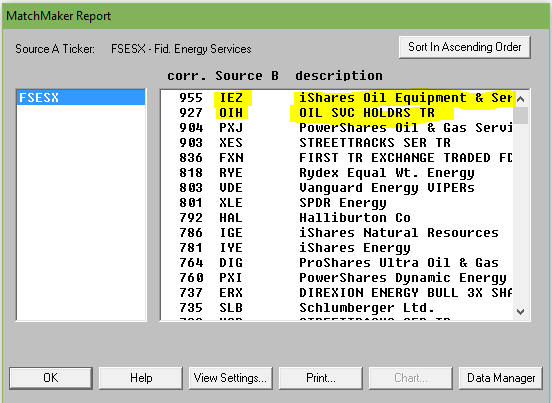
Matchmaker uses Spearman Rank Correlation analysis to identify a close match to FSESX. The closer the result to 1000, the higher the correlation. Anything over 950 is a very close match. Here’s the results.
Figure 1. MatchMaker correlation for last 4 years – FSESX vs stocks and ETFs
The ETF IEZ – iShares Oil and Equipment & Services showed a very high correlation over the 4 years we tested. OIH – Oil Service Holders, another ETF, also showed high correlation.
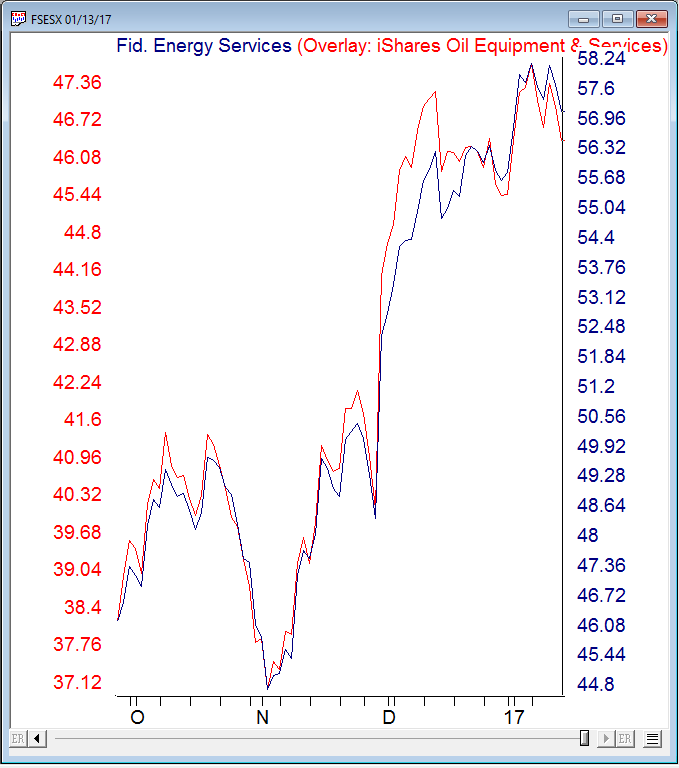
Here’s an AIQ overlay chart of recent daily price action comparing FSESX vs IEZ.
 
Figure 2. Recent daily price action comparing FSESX vs IEZ.
IEZ appears to be a good surrogate for FSESX at least over the last 4 years.
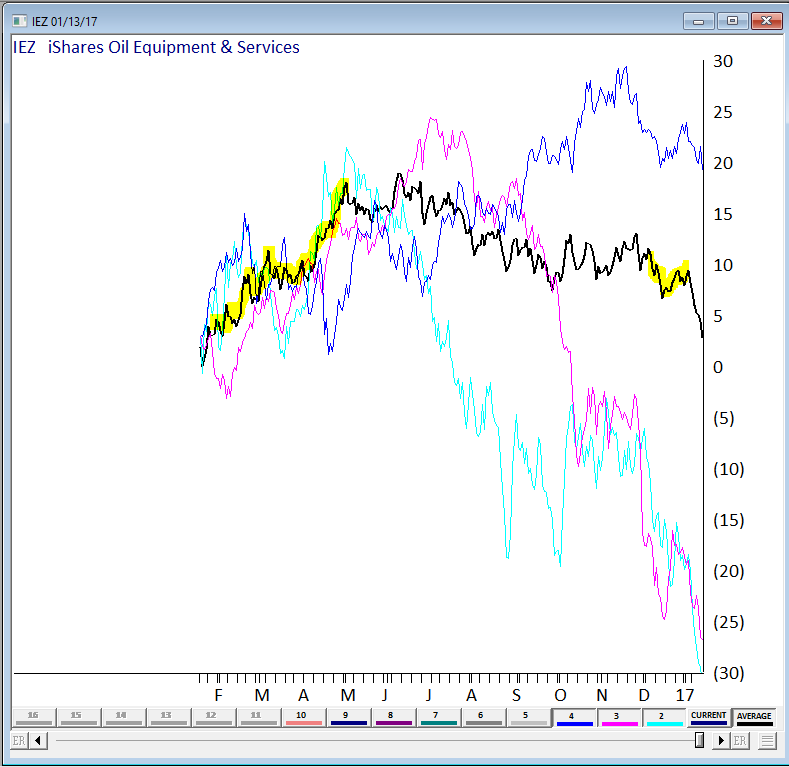
We also wanted a visual of the seasonal pattern in action. Fortunately we have a tool still in development at AIQ that’s just right for this. Basically it provides a price comparison of ‘x’ numbers of years of the same ticker overlaid on each other.
Here’s 3 of the last 4 years on IEZ, the average of the years displayed is in black. We highlighted the Feb, Mar, Apr and Dec in yellow. We could have included more years but for illustration purposes it was easier to show the 3 years (the chart gets busy with too many lines on it!)
 
Figure 3 – IEZ seasonal chart (beta) for 3 years with average.
The Feb, Mar, Apr period has a definite bullish tendency, the Dec period does Ok too. You’ll notice the tendency for IEZ to fall sharply in January. Conclusion? IEZ is a reasonable surrogate for FSESX if you’re contemplating this seasonal move.
_________________________________________________________
The article this follow up is based upon is by Jay Kaeppel and is included below. Jay is Chief Market Analyst at JayOnTheMarkets.com and AIQ TradingExpert Pro client. http://jayonthemarkets.com/

When to Feel ‘Energetic’ (or NOT)

If you are looking for a market sector with some serious seasonal trends, look no further than the energy sector. Previously I had noted the bullish tendency for ticker FSESX during the months of February, March and April.  In this piece, we will add one more “favorable” month and then also look at a 6-month “unfavorable” period.
For the record, the information that follows is not being recommended as a standalone strategy.  It is presented simply to make you aware of certain long-term trends that have been very persistently bullish (or bearish as the case may be) in the energy sector.
4 Favorable Months
*The four “favorable” months for our test are February, March, April and December
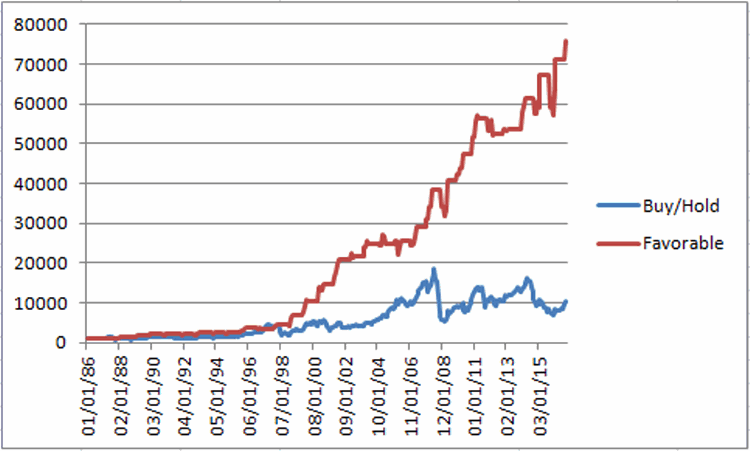
Figure 1 displays the growth of $1,000 invested in ticker FSESX only during these four months every year since 1986 versus simply buying-and-holding ticker FSESX.
1
Figure 1 – Growth of $1,000 invested in FSESX only during Feb, Mar, Apr, Dec every year since 1986
Starting in 1986, an initial $1,000 investment grew to $76,019 (or +7,500%) versus $10,237 (or 923%) using a buy-and-hold strategy.
6 Unfavorable Months
The six “Unfavorable” months are June, July, August, September, October and November.
First the “positive” news:
*This 6-month period has managed to show a gain 14 times in 31 years – so by no means should you consider this period a “sure thing” loser
*During 4 separate years – 1997, 2003, 2004 and 2010 – the “unfavorable” months registered a cumulative gain in excess of +30%.
Doesn’t sound all that “unfavorable” so far does it?  But here’s the catch: Despite the occasional 30%or more gain, it is fair to refer to this 6-month period as “unfavorable” as the cumulative long-term results of buying and holding FSESX during these months has been nothing short of devastating.
Figure 2 displays the growth of $1,000 invested in ticker FSESX only between the end of May and the end of November every year starting in 1986.
3
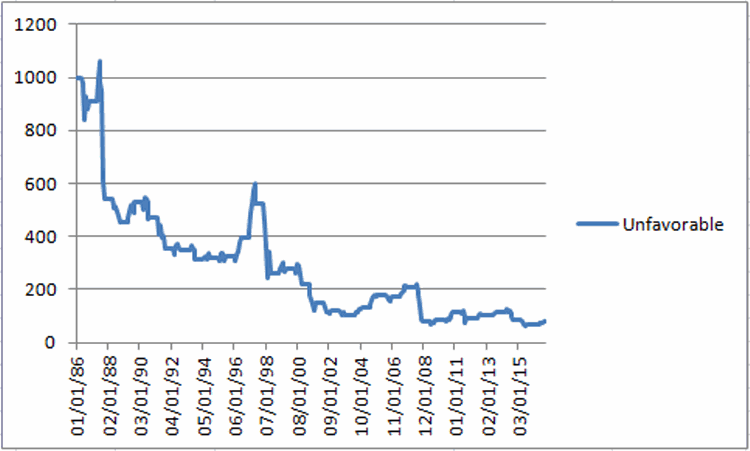
Figure 2 – Growth of $1,000 invested in FSESX only during June through November every year since 1986
Starting in 1986, an initial $1,000 investment declined to just $82, or a cumulative loss of -91.8%
Figure 3 displays some comparative data between favorable and unfavorable periods as well as using a Buy-and-Hold strategy.
Measure Buy-and-Hold 4 Favorable Months 6 Unfavorable Months
Average Annual % +(-) 12.8 16.5 (-4.2)
Median Annual % +(-) 8.7 15.5 (-1.8)
Standard Deviation 33.4 20.1 24.6
# Years UP 18 26 14
# Years DOWN 13 5 17
Worst Year (-55.4) 2008 (-7.6) 1994 (-62.8) 2008
$1,000 becomes $10,237 $76,019 $82
Cumulative % +(-) +923% +7,500% (-92%)
Figure 3 – Comparative Results
Figure 4 displays the year-to-year results for a Buy-and-Hold approach versus holding only during the 4 “favorable” months or the “Unfavorable” 6 months.
Year All 12 months % +(-) 4 Favorable % +(-) 6 Unfavorable % +(-)
1986 (8.9) (5.2) (9.2)
1987 (20.7) 22.9 (40.1)
1988 (4.2) 22.8 (16.3)
1989 50.3 27.1 16.2
1990 8.7 4.9 (11.2)
1991 (19.9) 4.1 (25.0)
1992 4.9 (1.6) (1.3)
1993 16.4 24.5 (10.7)
1994 (0.5) (7.6) 3.1
1995 40.0 33.7 2.0
1996 45.9 22.5 20.8
1997 43.9 (4.9) 32.9
1998 (41.4) 26.5 (50.5)
1999 80.9 74.1 7.5
2000 51.7 77.6 (21.1)
2001 (22.4) 20.8 (32.4)
2002 2.2 26.2 (18.0)
2003 13.1 15.5 (16.0)
2004 26.2 1.2 30.2
2005 47.4 4.8 34.0
2006 (9.1) (4.1) (1.8)
2007 58.3 25.6 16.7
2008 (55.4) 10.5 (62.8)
2009 60.4 24.5 9.6
2010 31.7 21.6 33.7
2011 (18.5) 3.1 (16.8)
2012 (3.9) 0.7 9.6
2013 14.1 0.3 11.5
2014 (19.5) 7.2 (26.7)
2015 (19.7) 2.9 (17.9)
2016 44.2 28.4 20.1
Figure 4 – Yearly % +(-) for Buy-and-Hold versus 4 Favorable Months versus 6 Unfavorable Months
Summary
There is no guarantee from year-to-year results of buying and holding ticker FSESX during the “Favorable 4” months will show a gain and/or outperform the “Unfavorable 6” months. And there is by no means any guarantee that the “Unfavorable 6” will show a loss during any given year (note that 2016 saw the Unfavorable 6 generate a cumulative gain of +20.1%!).  So just remember that we are talking about some very long-term  trends here.
Still, most investors can discern the difference between:
*Favorable 4 months gain = +7,500%
*Unfavorable 6 months loss = (-92%)
This type of difference is what we “quantitative types” refer to as “statistically significant.”