Category Archives: back testing

Back to Basics with MACD

One danger of getting “way to into” the financial markets is that you can find yourself progressing into some needlessly complicated stuff (“Hi, my name is Jay”).  I mean it is only natural to wonder “hey, what if I divided this indicator value by that indicator value” and such.  But once you start finding yourself taking an exponential moving average of a regression line with a variable lag time, well, you can find yourself “a tad far afield.”  (Trust me on this one).  Which leads us directly to:
Jay’sTradingMaxim #44: Every once in awhile it pays to remember that the end goal is simply to make money.  The more easily the better.
So today let’s go back to a simple “basic approach.”
The Bullish MACD Divergence
We will define an “asset” as any stock, ETF, commodity, index, etc. that can be traded on an exchange (and for my purposes, there should be a liquid market for options on that asset).
Step 1. An asset price falls to a new 20-day low and the MACD value is less than 0.  Note the MACD value on this date.
Step 2. Not less than one week but not more than 2 months later:
*Price closes below its closing level in Step 1
*The MACD indicator is above its level at the time of Step 1
Step 3. The next time the daily MACD indicator “ticks higher” a buy alert is triggered
Can it really be that simple?  The Good News is “Yes, it can.”  The Bad News is that “It isn’t always.”  To put it another way, like a lot of trading methods it can generate a surprising abundance of useful trading signals.  However, there is no guarantee that any given signal will turn out to be timely.  In other words:
This method gives you a good guideline for when to get in, but:
*It may be early at times (i.e., price will move lower still before advancing)
*It will at times be flat out wrong
*You still have to decide when to exit the bullish position.
*Call options are useful with this approach as it allows you to risk a limited amount of capital.
Examples
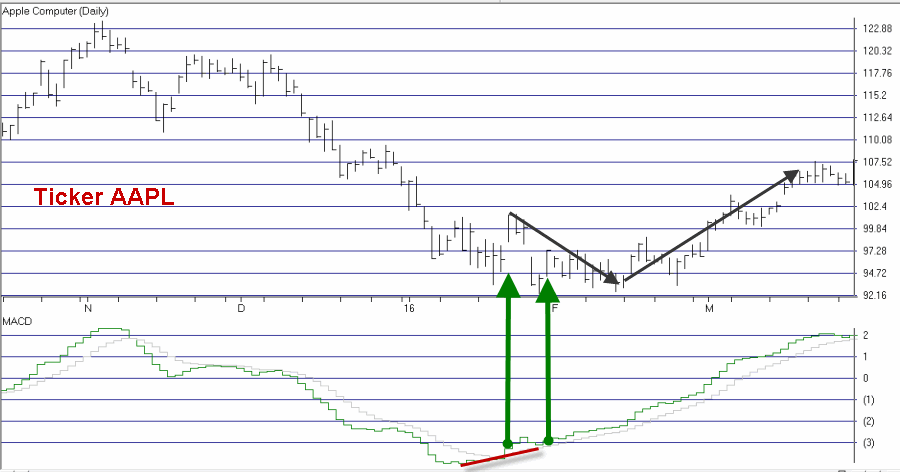
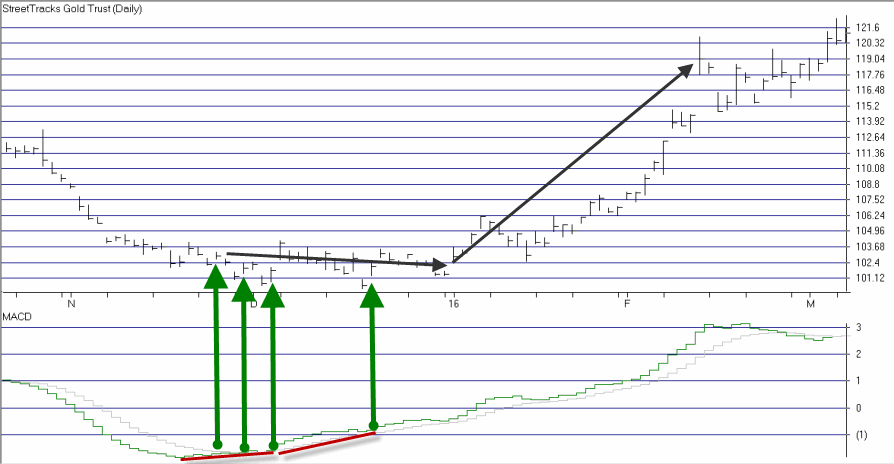
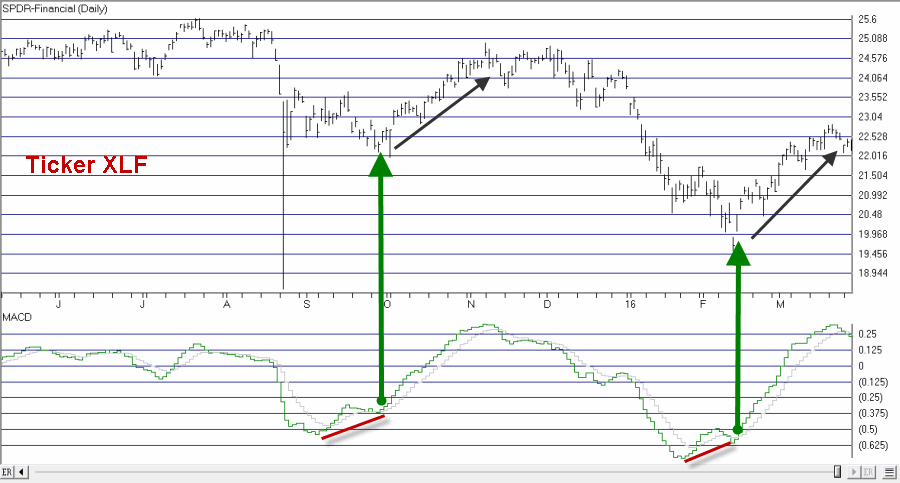
Figures 1 through 4 highlight some recent examples using this method.  Note that the charts show only entry points.  Exit points are “a separate topic”.
1
Figure 1 – Ticker XLF (Courtesy TradingExpert Pro)
2
Figure 2 – Ticker WMT (Courtesy TradingExpert)
3
Figure 3 – Ticker AAPL (Courtesy TradingExpert)
4
Figure 4 – Ticker GDX (Courtesy TradingExpert)
As you can see, some signals were quite timely while others were quite early.  For the record, I started getting bullish on gold and gold stocks early in 2016 based in part on the multiple alerts that appear in Figure 4.
Chief Market Analyst at JayOnTheMarkets.com and TradingExpert Pro client
ADX Breakouts

The AIQ code based on Ken Calhoun’s article in the March 2016 issue of Stocks and Commodities, “ADX Breakouts,” is provided at www.TradersEdgeSystems.com/traderstips.htm.
Since I mainly work with daily bar strategies, I wanted to test the ADX concept from the article on a daily bar trading system. So I set up a system that buys after a stock has based around the 200-day simple moving average (Basing200). Basing200 is coded in the system as:
  • The stock closing above the 200-SMA only 19 bars or less out of the last 100 bars, and
  • The stock closing greater than two bars above the 200-SMA in the last 10 bars.
For exits, I used the following built-in exits: a capital-protect exit set at 80% and a profit-protect exit set at 80% once profit reaches 5% or more.
I ran this system on the NASDAQ 100 list of stocks in the EDS backtester over the period 12/31/1999 to 1/11/2016. I then ran a second test on the system using the ADX filter (ADX must be greater than 40 at the time of the signal to buy). I used the same list of stocks, exits, and test period.
Figure 8 shows the first test without the filter: 883 trades, 1.84% average profit per trade, 1.51 reward/risk. Figure 9 shows the second test with the filter: 151 trades, 2.12% average profit per trade, 1.66 reward/risk.
Sample Chart
FIGURE 8: AIQ, WITHOUT FILTER. Here are the EDS test results for the example system without the ADX filter.
Sample Chart

FIGURE 9: AIQ, WITH FILTER. Here are the EDS test results for the example system with the ADX filter.
Although all of the key metrics are better with the filter, there is a significant reduction in the number of trades. In fact, 151 trades would not be sufficient for a trading system over this long test period. If one wanted to use the filter, then the list of stocks would need to be increased to about 2,000 stocks.
!ADX BREAKOUTS
!Author: Ken Calhoun, TASC March 2016
!Coded by: Richard Denning, 1/11/2016
!www.TradersEdgeSystems.com

!NOTE; THIS SAMPLE SYSTEM IS FOR 
           !DAILY BAR TESTING OF ADX FILTER ONLY

SMA200 is simpleavg([close],200).
HD is hasdatafor(250).
Above200 if ( [close] > SMA200 ) .
Basing200 if CountOf(Above200,10) >2
 and CountOf(Above200,100) 200. 
ADXhi if [ADX] >= 40.
BuyADX if Buy and ADXhi.
This code and EDS file can be downloaded from www.TradersEdgeSystems.com/traderstips.htm.
—Richard Denning
info@TradersEdgeSystems.com
for AIQ Systems