Some call it a “Santa Claus Rally” or
“Year-End Rally.” Others call
it an early “January Effect.” Whatever
the name, we just entered a bullish seasonal period for equities. Jay Kaeppel, author of Seasonal Stock Market Trends, crunched the numbers to demonstrate
the bullish market tendencies surrounding the Thanksgiving to New Year’s
holiday season. Here are the results:
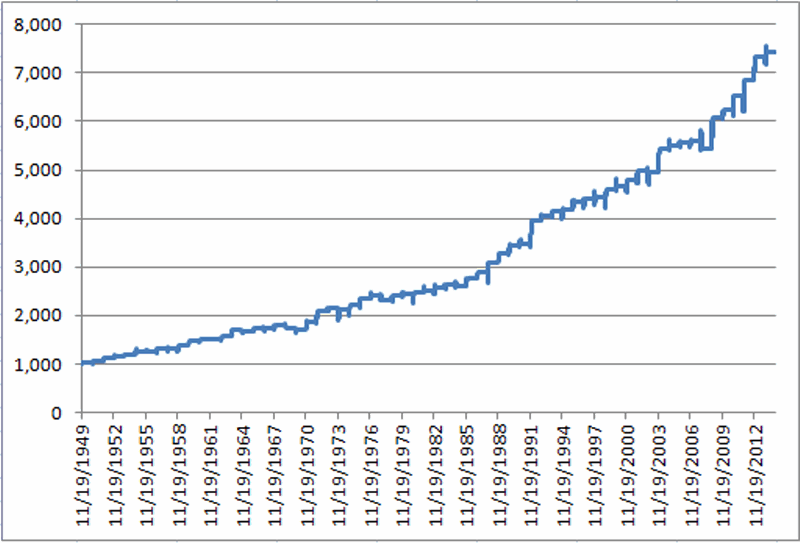
The bullish
period starts the Monday before Thanksgiving and ends the third trading day in January. Since 1949, the Dow Jones Industrial Average
was up on 54 occasions, or 83 percent of the time during the this period. Even more bullish, the trading period
witnessed a gain in 27 of the last 29 years!
The average gain was 3.2 percent while the median gain was 3.1
percent. The largest gain was 13.9
percent in 1991-92. The worst period was
-3.7 percent in 1977-78.
What does
this mean for portfolio returns? If you
invested $1000 in the Dow only during the bullish period (Monday before Thanksgiving
to third trading day in January) the portfolio would now be $7400. That’s very good, especially since this
assumes you make no money from January to mid-November of every year.
Does this
mean stocks will rally in the seasonal period we just entered? Investing in seasonal patterns is a bet on
odds or probabilities and this year stocks entered the period right after a
monster rally. While history shows
losses can occur, the statistics point toward higher stock prices between now
and early January. That’s fine by me!
— David Vomund is an Incline Village-based fee-only money
manager. Information is found at www.ETFportfolios.net or by calling 775-832-8555. Clients hold the positions mentioned in this
article. Past performance does not
guarantee future results. Consult your
financial advisor before purchasing any security.
manager. Information is found at www.ETFportfolios.net or by calling 775-832-8555. Clients hold the positions mentioned in this
article. Past performance does not
guarantee future results. Consult your
financial advisor before purchasing any security.