S&P 500 Update 3-30-25 + This Weeks Featured Buy Signal LKNCY
From Trading Floor Researchhttps://aiqeducation.com/tfr-2/, the first month is FREE. Newsletter and Alerts. Exactly When and What to Enter and Exit.
S&P 500 Update 3-30-25
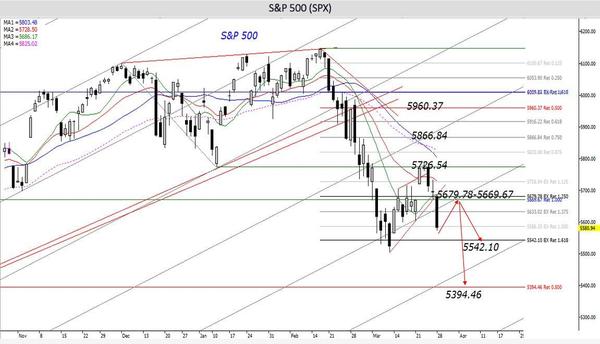
The S&P 500 was unable to surpass 5773.31 for three consecutive sessions last week and encountered strong resistance at the Fibonacci target. An evening doji star pattern formed under the target area, indicating that the S&P 500 retracement would end and the downtrend would resume. 5773.31 is the January 13 low. Old lows make new highs, and the pattern highlights the significant resistance. An evening doji star pattern often warns of an impending top.
Friday’s Close under Fibonacci support at 5679.78 confirmed the resumption of the downtrend. A close under the significant Fibonacci support at 5542.10 would send the S&P 500 considerably lower. So far, the index has found support at this level, resulting in an eight-session bounce. A retest that holds and provides confirmation from this level would likely lead to a more significant bounce. Closing below should send the S&P 500 to the next Fibonacci target at 5394.96. Additionally, the S&P 500’s monthly close below 5921.02, a significant event after many months of avoidance, has raised the possibility of a substantial selloff. This could potentially reach the Fibonacci 4804.96 level, and a further dip below this plane could lead to a total market collapse and a major Fibonacci target at 3742.02.
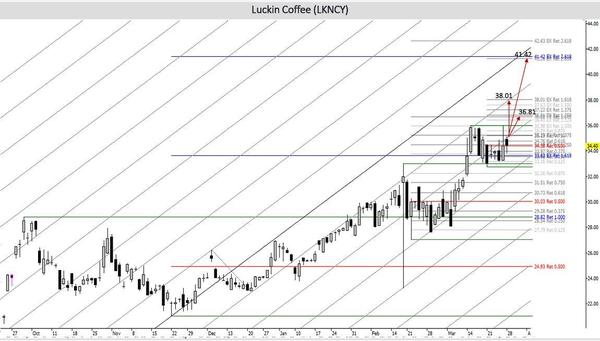
Featured Buy Signal LKNCY
I am repurchasing Luckin Coffe (LKNCY) following confirmation at $35.21. The Fibonacci targets are 36.81, 41.42, and 42.63. The stop is a close below 33.63.. The stop is a close below 3.92.
Take the Guesswork Out of Trading – We Do the Analysis, You Get the Alerts!
Why waste hours analyzing charts when you can get real-time Buy & Sell alerts sent straight to your phone?
With Trading Floor Research Alerts, you’ll never miss an opportunity. Get notified the moment the market shifts—no complicated analysis required!
✅ Instant Buy & Sell Alerts via text ✅ No guesswork—just act on the signals ✅ Works for stocks, ETFs
Point and Figure (P&F) charting is a time-honored technique in technical analysis, emphasizing price movements while filtering out minor market fluctuations. This method is particularly adept at identifying significant patterns such as triple tops and triple bottoms, which signal potential bullish or bearish reversals in stocks and ETFs.
Understanding Triple Tops and Bottoms in P&F Charts
A triple top buy signal materializes when a column of Xs surpasses the peaks of two preceding X columns, indicating that buyers have overcome resistance after two prior unsuccessful attempts.
Conversely, a triple bottom sell signal occurs when a column of Os drops below the troughs of two preceding O columns, suggesting that sellers have overpowered support after two prior unsuccessful attempts. These formations typically require at least five columns to develop, and their breakouts often lead to substantial price movements due to the extended consolidation period.
Point and Figure triple tops and bottoms are not the same as those found in traditional bar or candlestick charts
It’s important to note that Point and Figure triple tops and bottoms are not the same as those found in traditional bar or candlestick charts. In conventional charting, a triple top or bottom forms when the price touches a support or resistance level three times without breaking through.
However, P&F charts focus solely on price movement and disregard time, which means these patterns emerge from a different logic. In P&F charts, the emphasis is on the number of times a price level is tested and subsequently broken, providing a clearer and often more decisive signal when the breakout occurs. This price-centric focus can make P&F triple tops and bottoms more reliable in identifying major breakouts, as they filter out insignificant price noise caused by time-based fluctuations.
Optimal Settings for Detecting Triple Tops and Bottoms
The effectiveness of P&F charts in identifying these patterns hinges on the selection of box size and reversal amount:
Box Size: This parameter determines the price increment represented by each box on the chart. Larger box sizes can filter out insignificant price movements, highlighting more substantial trends, while smaller box sizes capture finer price details but may introduce noise. It’s advisable to adjust the box size based on the asset’s volatility; more volatile stocks or ETFs may require larger box sizes to effectively filter out minor price fluctuations. Commonly used box size settings include:
For stocks priced under $5: 0.10 or 0.25 box size
For stocks priced between $5 and $20: 0.50 box size
For stocks priced above $20: 1.00 box size
Percentage-based box sizes (e.g., 1% or 2%) are also popular for adjusting dynamically to the asset’s price level.
Reversal Amount: This setting dictates the number of boxes required to indicate a trend reversal and initiate a new column. A standard practice is to use a three-box reversal, which balances sensitivity and reliability in trend detection. This means that a price movement must reverse by at least three box sizes to warrant a shift from a column of Xs to Os, or vice versa.Typical reversal settings include:
1-box reversal for highly sensitive, short-term analysis
3-box reversal for balanced, medium-term analysis (most widely used)
5-box reversal for long-term, major trend analysis
NOTE: AIQ Reports and AIQ Charts utilize these most common settings for Point & Figure.
Empirical Support for Optimal Settings
The research underscores the efficacy of these settings. For instance, studies have demonstrated that double-top and double-bottom patterns, which are foundational to triple formations, exhibit high profitability rates. Robert EarlDavis found double tops to be profitable 80.3% of the time and double bottoms 82.1% of the time. Additionally, John Anderson’s study reported a combined profitability for these patterns, ranking them among the top-performing formations.
AIQ Reports Point & Figure Breakout
Point & Figure Upside Breakout Report 2-27-25
Chart of YUM with regular price chart at 2-27-25 and Point & Figure Chart breakout below.
Point & Figure Downside Breakout Report 2-27-25
Chart of DXC with regular price chart at 2-27-25 and Point & Figure Chart breakout below.
Conclusion
In summary, to effectively identify triple top and bottom patterns in stocks and ETFs using end-of-day P&F charts, a three-box reversal setting is generally recommended. Additionally, understanding the distinction between P&F and traditional chart patterns is essential, as the price-centric nature of P&F charts often results in more decisive and actionable breakout signals.
At AIQ Systems, we proudly announce our latest achievement in the world of intelligent trading technology!
In the 2025 Stocks & Commodities Readers’ Choice Awards, AIQ TradingExpert Pro has been recognized as the 1st Runner-Up for “Best Artificial Intelligence Trading Software.”
This accolade is not just a one-time success—it’s the culmination of years of dedication to empowering traders with cutting-edge technology. Our recent recognition follows a consistent track record of excellence:
1st Runner-Up, 2025
Finalist, 2024
Semi-Finalist, 2023, 2022 & 2021
These awards, voted on by the readers of Stocks & Commodities magazine, reflect the trust and confidence that professional and independent traders place in AIQ TradingExpert Pro as the world leader in intelligent trading software.
What Sets AIQ TradingExpert Pro Apart?
AIQ TradingExpert Pro isn’t just software—it’s a comprehensive trading solution built on advanced artificial intelligence designed to help traders navigate volatile markets with precision and confidence. Here are a few key features that have made us an industry favorite:
Intelligent Timing Signals: We deliver actionable buy and sell signals that help traders time the market effectively, even in volatile conditions.
Proven Track Record: With over three decades of innovation, we continue to refine our software to meet the evolving needs of modern traders.
Thank You to Our Users!
We owe this recognition to our incredible community of traders who trust AIQ Systems to deliver powerful insights and smarter trading strategies. Your feedback and support inspire us to push the boundaries of what can be achieved in the financial markets.
As we celebrate this milestone, we remain committed to providing the most advanced, reliable, and user-friendly trading software available. Here’s to another year of empowering traders worldwide!
Ready to experience the power of AIQ TradingExpert Pro for yourself? Discover why we’re a consistent leader in intelligent trading software: 30-day trial https://aiqeducation.com/1-trial/
A 45-minute session with Steve Hill, CEO of AIQ Systems. Many traders have shifted away from the traditional 12,26,9 MACD when trading short-term stocks, ETFs, or options, favoring settings that respond more quickly to price movements. While no setting is universally “best,” we’ll cover a few configurations that are used by experienced traders.
Configuring MACD for shorter term trades March 13, 2025 2pm Eastern
45-minute session with Steve Hill, CEO of AIQ Systems. Many traders have shifted away from the traditional 12,26,9 MACD when trading short-term stocks, ETFs, or options, favoring settings that respond more quickly to price movements. While no setting is universally “best,” we’ll cover a few configurations that are used by experienced traders.