Testing a Trading System with Walk-forward Testing + Spring Market Forecast
March 13, 2024 05:00 PM Eastern Time (US and Canada)
In the first half of this meeting, Steve Hill, CEO of AIQ Systems will use two strategies both of which have 3 indicator confirmations, and run them through the AIQ Portfolio simulator to test their effectiveness using real-life walk-forward testing.
In the second half, David Wozniak of TFRTrader will take us through Charts of the Markets, Sectors, Industry Groups, and Stocks, highlighting how he picks stocks to trade.
How to make a multi-indicator entry with an exit strategy
February 21, 2024
An hour-long session with Steve Hill, CEO of AIQ Systems. In this session, Steve will use the AIQ Expert Design Studio to create a multi-indicator entry strategy and incorporate an indicator and other exit strategies during backtesting.
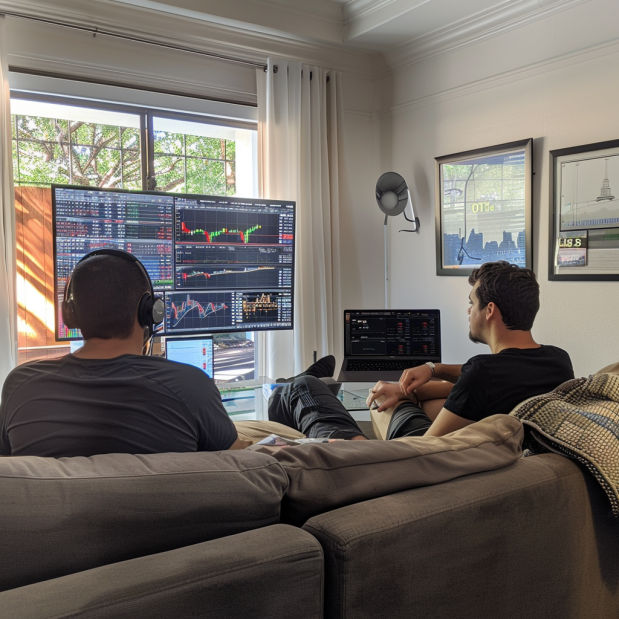
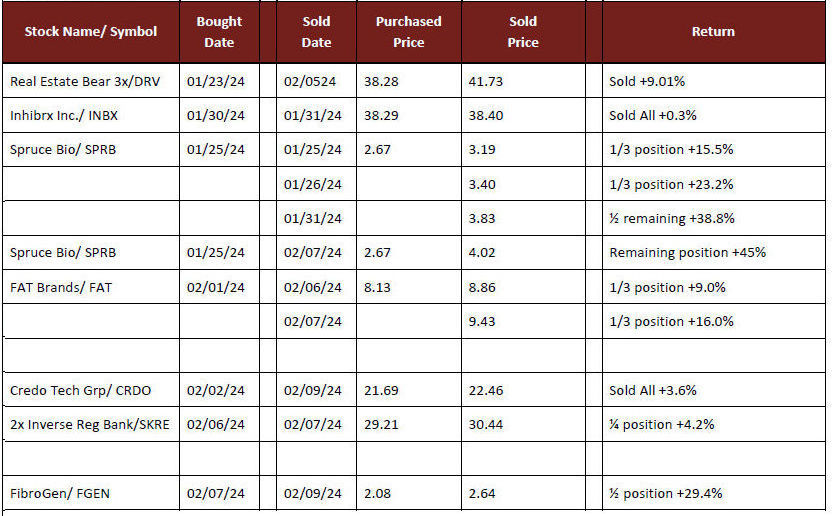
Long-time AIQ client and Money Manager David Wozniak has an enviable track record – Recent Trades Speak for Themselves.
His service includes:
***Actionable alerts to your cell phone ***
It’s not hard to come across stock alerts or picks, from newsletters to talking heads on television to alerting systems. Unfortunately, most of the time these services are no better than guesswork. But what if you could get solid, practical alerts about when to buy and sell stocks?
Wouldn’t it be better to get buy and sell signals and the insights that generated them, from someone who is not just trying to market their way of life?
*** That’s where TFR comes in ***
As a TFR subscriber, you will get all the details you need to enter and manage your trades. Furthermore, the underlying research for the alerts is done by an experienced CMT who has managed money for over 30 years.
TFR is Trading Floor Research and was founded by David J Wozniak. He is a Certified Market Technician (CMT) and Chief Market Strategist at TFR.
*** High Probability Trading Setups ***
You’ll always be on top of the markets with TFR’s twice-weekly e-mail newsletter! You’ll receive the latest industry group, individual stock, ETF buy signals, and research reports that will guide you on entry points, high-likelihood sell targets, and stop-loss numbers.
And with text alerts to confirm buys and notify you when stocks hit their sell targets, you’ll never miss a chance to capitalize on a great opportunity!
“Thanks to David and Trading Floor Research (TFR), I was able to make two profitable trades on GO and LABU – each one netting me a 16% return. The text messages were prompt and enabled me to act quickly!”
*** Take the Emotion Out of Your Trading Process ***
Maximize your likelihood of success while minimizing stress. Let Trading Floor Research provide you with unique stock trades and show how to allocate your investments accordingly. TFR will take you step by step from the start to the end of the trade.
How to make a multi-indicator entry with exit strategy –
February 21, 2024 5pm eastern
An hour-long session with Steve Hill, CEO of AIQ Systems. In this session, Steve will use the AIQ Expert Design Studio to create a multi-indicator entry strategy and incorporate an indicator and other exit strategies during backtesting.
In this video I’ve covered the last 6 months of up and down Market ratings generated by the Artificial Intelligence system in our TradingExpert Pro analysis platform. #marketanalysis #markettiming #dowjones #ai #AIQsystems.
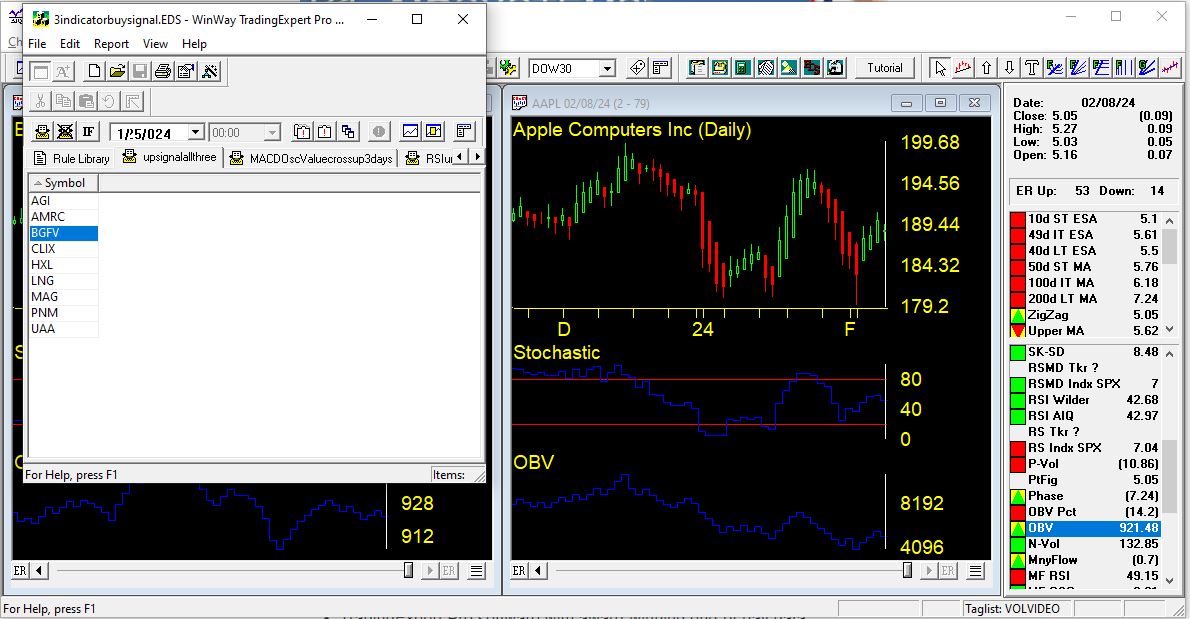
Break Free from Market Noise! 🚀 Uncover Hidden Trades with TradingExpert Pro’s AI-Based Signals and Charting Power! 📈📊
Tired of constant advice and rumor mongering? TradingExpert Pro brings you:
🌟 AI-Based Signals: Gain an edge with award-winning AI-based expert systems that screen for trading candidates others might miss.
🚀 Top Industry Sectors: Zero-in on leading and lagging issues with daily group and sector analysis reports.
⏰ Time-Saving Analysis: The Chart Barometer provides instant evaluations of indicators, saving you time for a clear analysis.
🔍 Explore Feature: Fast searching of lists and industry groups, combining superb chart displays with an easy user interface.
📊 Custom Layouts: Every chart your way! Choose price bar, candlestick, or point and figure charts, and customize layouts effortlessly.
🔄 200 Screening Reports: Access one and two-page reports highlighting trading candidates automatically generated each day.
🛠️ Expert Design Studio: Design, test, and automate trading ideas easily. Pre-built strategies include Growth, Divergence, Short Selling, Day Trading, and more.
🌐 Whether stocks, mutual funds, futures, FOREX, or markets, TradingExpert Pro empowers your trading journey. Ready to revolutionize your trading experience? Explore the possibilities now! 🚀💹”
TradingExpert Pro End of Day 30-day trial with subscription to end of day data only $1*