In this piece I wrote about a strong seasonal tendency in corn based on the planting cycle. Turns out soybeans are in the same boat. This can be a good thing for traders who are, a) willing to speculate, b) not dumb enough to the bet the ranch.
(See also Jay’s Trading Maxim’s (Part 1))
The Trend
Figure 1 displays the annual seasonal trend for soybeans (from www.sentimentrader.com). Just as with corn, the months of February through April tend to see positive results. Please note the use of the word “tend” and the lack of the words “sure” or “thing”.
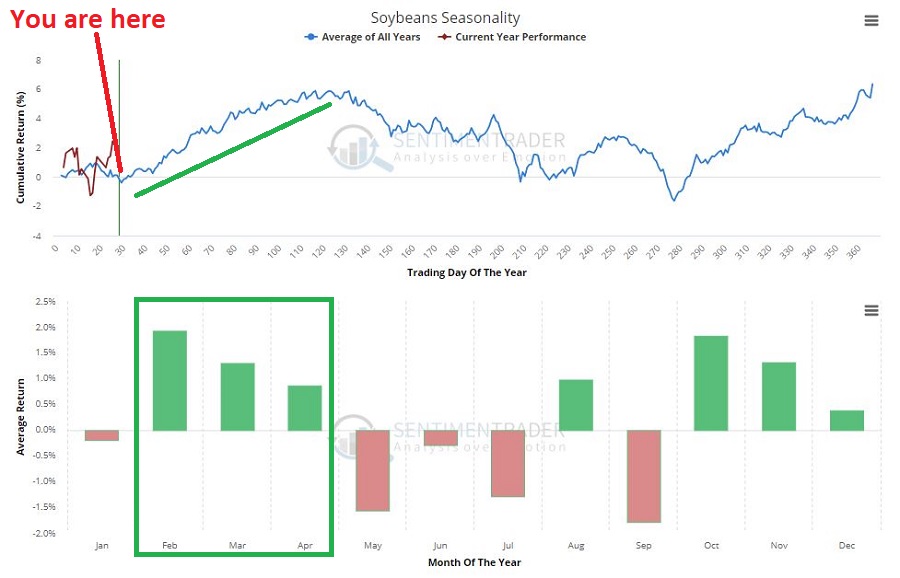
Figure 1- Soybean Annual Seasonal Trend (Courtesy Sentimentrader.com)
The History
Figure 2 displays a monthly chart for soybeans going back 4 decades.
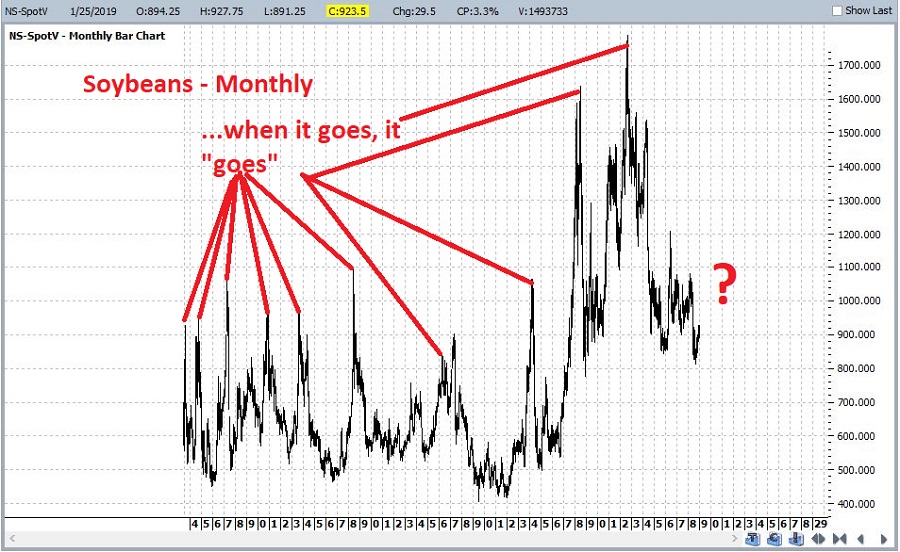
Figure 2 – Monthly chart for Soybeans (Courtesy ProfitSource by HUBB)
Here are the two things to note (using some pretty technical terms):
*Soybeans (like most commodities) spend a lot of time “churning”, “grinding”, “consolidating” and generally going “nowhere”
*HOWEVER, “when beans go they really go!” (hopefully that wasn’t “too technical”)
*The primary thing to remember is that when soybeans get going to the upside, typically the best thing to do is to banish the word from “overbought” from your trading lexicon. See Figure 3.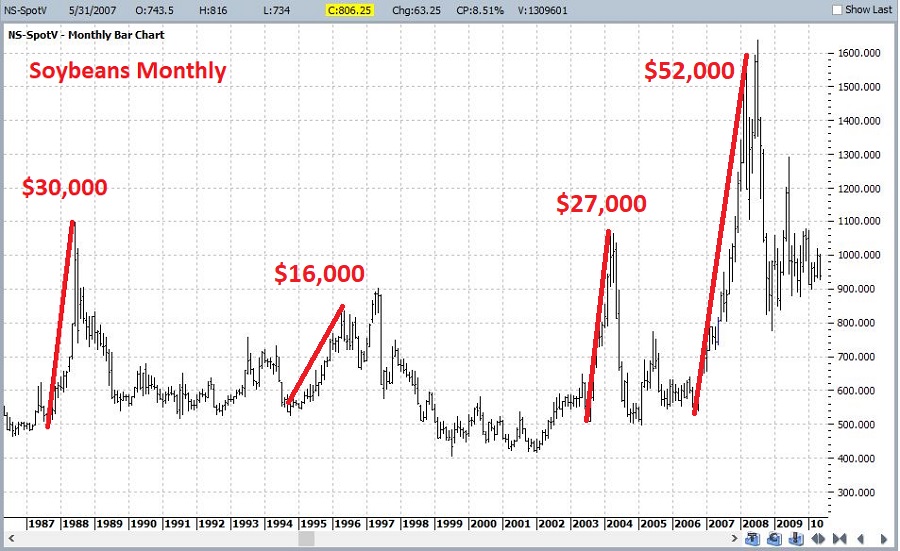
Figure 3 – Big moves in Beans (Courtesy ProfitSource by HUBB)
Now let’s focus on the months of February, March and April. Figure 4 displays the hypothetical $ growth (no slippage or commissions) from holding long a 1-lot of soybean futures during February, March and April every year starting in 1976.
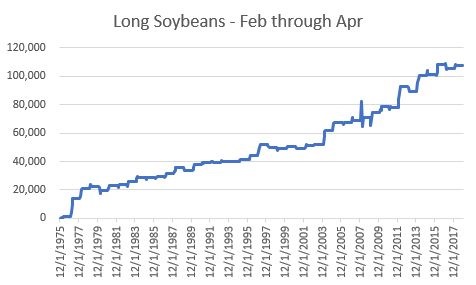
Figure 4 – Long 1 soybean futures contract during Feb-Mar-Apr every year since 1976
The Results
Some things to note regarding Feb-Apr in soybeans:
*# of times UP = 33
*# of times DOWN = 10
*Average $ gain = +$3,808
*Average $ loss = (-$1,788)
*Largest gain = +$15,025
*Largest loss = (-$3,775)
In sum, a winners to losers ratio of 3.3 (or 76% winners), an average win to average loss ratio of 2.13-to-1
Bottom line: these are great numbers for traders BUT they entail the assumption of significant risk (2017 saw a loss of over -$3,400)
An Alternative Way to Play
Ticker SOYB is the Teucrium ETF designed to track the price of soybeans. SOYB allows traders to buy soybeans just as they would buy shares of stock. Just remember that you don’t get the same leverage buying SOYB as you would buying a futures contract.
Figure 5 displays a monthly chart for SOYB and Figure 6 displays a daily chart. Note the significant resistance level at around $16.96 a share. If SOYB takes out that level sooner than later it might be a bullish sign.
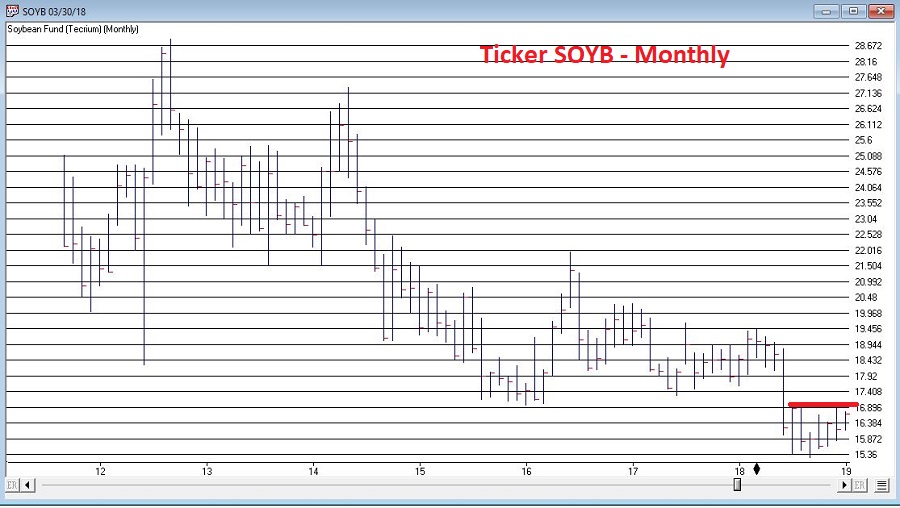
Figure 5 – SOYB Monthly (Courtesy AIQ TradingExpert)
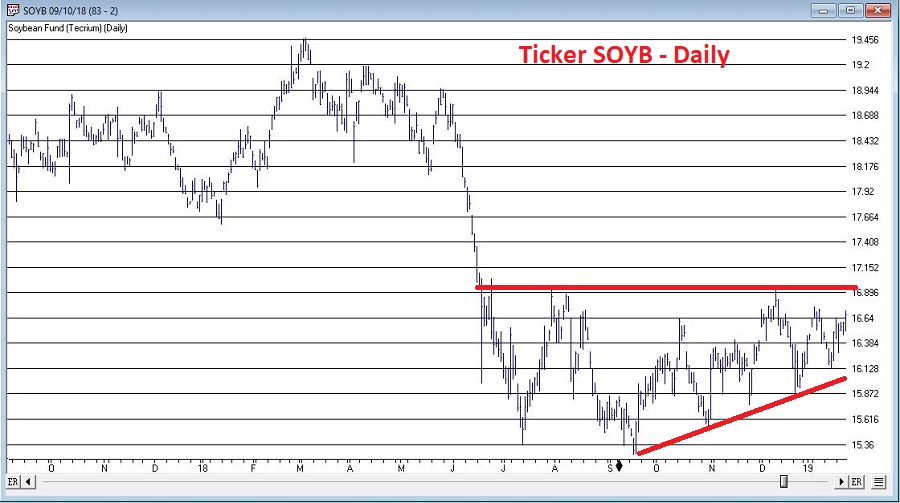
Figure 6 – SOYB Daily (Courtesy AIQ TradingExpert)
Summary
Soybeans have been beaten down a bit over the last several years. If (and “yes”, that is a big “If”) beans are going to make a move higher, history suggests that the Feb through April period is a likely time for that to happen.
Am I “recommending” or even “merely suggesting” that you should buy soybean futures or ticker SOYB? Not at all. I adhere to that old media adage of “We (I) report, you decide.”
Which is better I think than the current motto of major media which appears to be “We decide, then we report our decision.”
Jay Kaeppel
Disclaimer: The data presented herein were obtained from various third-party sources. While I believe the data to be reliable, no representation is made as to, and no responsibility, warranty or liability is accepted for the accuracy or completeness of such information. The information, opinions and ideas expressed herein are for informational and educational purposes only and do not constitute and should not be construed as investment advice, an advertisement or offering of investment advisory services, or an offer to sell or a solicitation to buy any security.