Hello Everyone,
Market Recap:
On my last Bartometer I stated that we were #1 On Buy signal, #2 the Dow Jones and the stock market had Bullish Ascending triangles patterns, #3. Money flow and On Balance Volume were breaking out to NEW HIGHS when the stock market wasn’t. This shows demand for stocks over and above the price. These 3 indicators were telling me and I was telling you that I thought the market would breakout to new highs, AND IT DID. The stock market broke out of the bullish ascending triangle, (see index on the next page about ascending triangles)*. On the S&P I said that it had to breakout of 3030 and it did. It is now 3093. I said the Dow Jones had to breakout of the 27400, and it did. It is now 27681.
Where does is go from here and could we get a little pull back?
See chart below for an explanation.
An excerpt from Fundamental Economist Dr. Robert Genetski: from Classical Principles.com:
Stocks benefited from encouraging news of a potential trade agreement between the US and China as well as some good news on the economy. Markets seldom move in only one direction. The S&P500 is now within 3% of its fundamental value. A pause or even a slight correction is overdue, particularly if there is any negative news. Even so, with stronger fundamentals and the Fed purchasing securities, any correction should be fairly mild. Stay bullish on stocks.
Adding to Bob’s his Comment:
Signs of strength in the economy combined with gains in stock prices led to a sharp jump in intermediate and longer-term interest rates. This week the interest rate on 10-year T-Notes moved 25 basis points higher. The latest moves turned the yield curve to a more normal shape. As with stocks, interest rates have spiked higher and are overdue for some correction. However, after more than a decade of interest rates declining and being well below their fundamental levels, rates remain 200 basis points below fundamental levels. While the Fed’s low target places a limit on how high interest rates will go, there is still a lot of upward potential for longer-term rates. Fixed-income portfolios should remain defensive.
On the Technical Side:
Over the last almost 22 months, the Dow Jones FINALLY broke out to new highs from the old highs set on Jan 31, 2018 at 26,714. That is a POSITIVE. Money Flow and On Balance Volume are still at a new high, but the markets are again becoming overbought. So, could the market comes down a little now? YES, the markets are now overbought and there could easily be a slight decline to 27191 to 27298, a decline of around 2%, and the S&P to decline to 3029 area, a decline of 2% or so, BUT no more than that, because if the markets GO BACK BELOW THE BREAKOUT it can cause traders to start selling in mass. So look for a possible test of the breakout, but IF the markets close below the breakout of 27300 to 27384 on the Dow Jones or 3030 on the S&P convincingly, then I will be getting Very Cautious. If that doesn’t happen then I am still moderately bullish. But I realize the market are now OVERBOUGHT and in my opinion, it is not a time to go out and invest a lot of money in the markets. Dollar cost averaging is fine. I stated in my January Bartometer that I thought the S&P could reach 3130 to 3180+ this year. At 3093 currently, that is about 1-3% from here.
Some of the INDEXES of the markets both equities and interest rates are below. The source is Morningstar.com up until November 9th, 2019. These are passive indexes.
*Dow Jones +20%
S&P 500 +24%
NASDAQ Aggressive growth +31%
I Shares Russell 2000 ETF (IWM) Small cap +19%
International Index (MSCI – EAFE ex USA) +16%
Moderate Mutual Fund +14%
Investment Grade Bonds (AAA) +13%
High Yield Merrill Lynch High Yield Index +11%
Floating Rate Bond Index +4.0%
Short Term Bond +4.0%
Fixed Bond Yields (10 year) +1.75.% Yield
The average Moderate Fund is up 14% this year fully invested as a 60% in stocks and 40% in bonds and nothing in the money market.
S&P 500
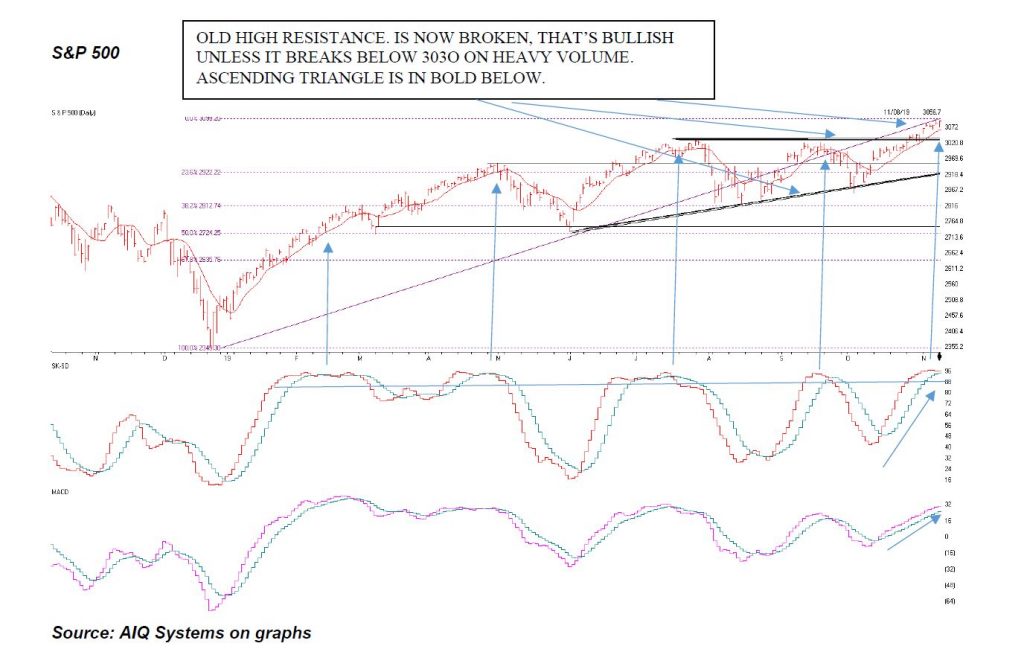
Ascending Triangle is above, and is Bullish as long as it stays above the breakout of 3027-3030
The S&P 500 is above. The S&P 500 contains 500 of the largest companies in the US. The 2 top companies by market value are Microsoft and Apple. But there are 498 other stocks in it. If you can see above the ASCENDING TRIANGLE that is BOLDED. Notice the clear breakout to new highs. This is clearly BULLISH like I thought would happen last month. And it did. Now that it has risen 2% ABOVE the breakout, a BREAKDOWN below the 3030 convincingly would get me VERY Cautious. It is normal to come back down to test the breakout, but not to break down below it. So if you see the S&P close below 3030 convincingly on heavy volume, I will be getting Cautious to Very Cautious depending on the reason. But the market is now at fair value to me and there may be another 1-4% more for the year in my opinion, but not much more unless there is incredible news from the Political or Tariff front. It is not a great time to go out and buy a lot in the stock market in my opinion as well.
The Middle graph is called the SK-SD Stochastics model. It shows the markets as being overbought when the indicator is above 88 where it is above the 88 horizontal line. Notice every time the indicator was above 88 it seemed to peak out and sell off. This is not guaranteed but it is good indicator.
The 3rd indicator is MACD or Momentum this indicator is still bullish until the pink line breaks down below the blue line. As of right now, momentum is still higher, but the markets are over bought, so be careful.
An ascending triangle is a chart pattern used in technical analysis. It is created by price moves that allow for a horizontal line to be drawn along the swing highs, and a rising trend line to be drawn along the swing lows. The two lines form a triangle. Traders often watch for breakouts from triangle patterns.
See the pattern above? It’s an Ascending triangle. Ascending triangles are BULLISH as long as they don’t go back below the breakout. If this is a successful Ascending triangle the S&P can rise to 3130-3180 first and possibly higher IF the breakout isn’t broken convincingly on the downside or breaking and closing below 3030.
On-balance volume (OBV) is a technical analysis indicator intended to relate price and volume in the stock market. OBV is based on a cumulative total volume.
Money flow is calculated by averaging the high, low and closing prices, and multiplying by the daily volume. Comparing that result with the number for the previous day tells traders whether money flow was positive or negative for the current day. Positive money flow indicates that prices are likely to move higher, while negative money flow suggests prices are about to fall.
A Support or support level is the level at which buyers tend to purchase or into a stock or index. It refers to the stock share price that a company or index should hold and start to rise. When the price of the stock falls towards its support level, the support level holds and is confirmed, or the stock continues to decline, and the support level must change.
- Support levels on the S&P 500 area are 3027-3030, 3017, 2952, 2922, and 2812. These might be BUY areas.
- Support levels on the NASDAQ are 8251, 8144, 8080 and 7771.
- On the Dow Jones support is at 26,285, 25,763, and 25,458
- These may be safer areas to get into the equity markets on support levels slowly.
- RESISTANCE LEVEL ON THE S&P 500 IS 3130 and the Dow Jones breakout is 27,400. If there is a favorable tariff settlement, the market should rise short term.
THE BOTTOM LINE:
The Dow, the S&P 500 and the NASDAQ are at new highs after rallying over the last 3 weeks. Normally the markets after reaching new highs become overbought and may come back down towards the breakout areas to see if the breakouts area holds. lf breakout of 3030 are holds then the markets tend to drift back towards the old high to see if it can break out again. If it does then 3130 to 3180 could be the next target. If 3030 doesn’t hold on the S&P and starts to break down below 3030 then I will be getting cautious or very cautious.. I WILL CONTINUE TO ANALYZE THE TECHNICALS OF THE MARKET. The seasonal patterns of the markets are bullish towards the end of the year. Last year the markets fell in December. It looks like the market still wants to go up, but with tweets coming out hourly, market timing will be more difficult.
Best to all of you,
Joe Bartosiewicz, CFP®
Investment Advisor Representative
5 Colby Way
Avon, CT 06001
860-940-7020 or 860-404-0408
SECURITIES AND ADVISORY SERVICES OFFERED THROUGH SAGE POINT FINANCIAL INC., MEMBER FINRA/SIPC, AND SEC-REGISTERED INVESTMENT ADVISOR.
Charts provided by AIQ Systems:
Technical Analysis is based on a study of historical price movements and past trend patterns. There is no assurance that these market changes or trends can or will be duplicated shortly. It logically follows that historical precedent does not guarantee future results. Conclusions expressed in the Technical Analysis section are personal opinions: and may not be construed as recommendations to buy or sell anything.
Disclaimer: The views expressed are not necessarily the view of Sage Point Financial, Inc. and should not be interpreted directly or indirectly as an offer to buy or sell any securities mentioned herein. Securities and Advisory services offered through Sage Point Financial Inc., Member FINRA/SIPC, an SEC-registered investment advisor.
Past performance cannot guarantee future results. Investing involves risk, including the potential loss of principal. No investment strategy can guarantee a profit or protect against loss in periods of declining values. Please note that individual situations can vary. Therefore, the information presented in this letter should only be relied upon when coordinated with individual professional advice. *There is no guarantee that a diversified portfolio will outperform a non-diversified portfolio in any given market environment. No investment strategy, such as asset allocation, can guarantee a profit or protect against loss in periods of declining values.
It is our goal to help investors by identifying changing market conditions. However, investors should be aware that no investment advisor can accurately predict all of the changes that may occur in the market.
The price of commodities is subject to substantial price fluctuations of short periods and may be affected by unpredictable international monetary and political policies. The market for commodities is widely unregulated, and concentrated investing may lead to Sector investing may involve a greater degree of risk than investments with broader diversification.
Indexes cannot be invested indirectly, are unmanaged, and do not incur management fees, costs, and expenses.
Dow Jones Industrial Average: A weighted price average of 30 significant stocks traded on the New York Stock Exchange and the NASDAQ.
S&P 500: The S&P 500 is an unmanaged indexed comprised of 500 widely held securities considered to be representative of the stock market in general.
NASDAQ: the NASDAQ Composite Index is an unmanaged, market-weighted index of all over the counter common stocks traded on the National Association of Securities Dealers Automated Quotation System
(IWM) I Shares Russell 2000 ETF: Which tracks the Russell 2000 index: which measures the performance of the small capitalization sector of the U.S. equity market.
A Moderate Mutual Fund risk mutual has approximately 50-70% of its portfolio in different equities, from growth, income stocks, international and emerging markets stocks to 30-50% of its portfolio in different categories of bonds and cash. It seeks capital appreciation with a low to moderate level of current income.
The Merrill Lynch High Yield Master Index: A broad-based measure of the performance of non-investment grade US Bonds
MSCI EAFE: the MSCI EAFE Index (Morgan Stanley Capital International Europe, Australia, and Far East Index) is a widely recognized benchmark of non-US markets. It is an unmanaged index composed of a sample of companies’ representative of the market structure of 20 European and Pacific Basin countries and includes reinvestment of all dividends.
Investment grade bond index: The S&P 500 Investment-grade corporate bond index, a sub-index of the S&P 500 Bond Index, seeks to measure the performance of the US corporate debt issued by constituents in the S&P 500 with an investment-grade rating. The S&P 500 Bond index is designed to be a corporate-bond counterpart to the S&P 500, which is widely regarded as the best single gauge of large-cap US equities.
Floating Rate Bond Index is a rule-based, market-value weighted index engineered to measure the performance and characteristics of floating-rate coupon U.S. Treasuries, which have a maturity greater than 12 months.