August 08, 2021
Hello Everyone,
The markets continue to rise to the 4420 level and surpassing the target of 4400 I had for the S&P 500. Earnings are coming in better than expectations for the most part and stocks are following earnings.
There are two things that make stocks rise, Earnings and Interest rates:
• If earnings are rising faster than expectations and rising 5-10%+ per year, then the markets should follow the rise in earnings, because the value of the company is based on what it earns over time.
• If interest rates stay low, then companies and consumers can borrow money at a low rate and invest. In addition, low interest rates let people afford houses and other larger purchases. With lower interest rates there is minimal competition for any other type of investment, like CD’s or money funds attracting people to them. There are few choices, that it why stocks are one of the only choices in which to invest. When interest rates rise to the 3 to 5% there is more competition away from stocks and more towards higher fixed rate bonds, CD’s, and money funds. Now that interest rates for the 10 year bond is 1.15% and money market rates are 0 to .5 of 1% people gravitate toward the stock market and real estate. That is the one of the main reasons the markets are high and could stay high as long as earnings grow, and interest rates stay relatively low. Over time the equity market continues to grow as earnings grow. THINK LONG TERM!
Seasonally and historically, August to October are not good times for the markets. August has been a time where the markets have “Topped Out” and start a decline toward a low in October. “Throughout the month of July, investors had been singing ‘Summertime, and the livin’ is easy,'” with the S&P 500 posting seven all-time highs, Sam Stovall, chief investment strategist at CFRA, wrote in a Monday note. “Unfortunately,” he added, the month of August “has a reputation for disappointing investors. “He notes that since 1945, “the S&P 500 posted its third-worst average monthly return, and third most volatile performance, in August. To make matters worse, while the S&P 500 was higher 55% of the time in August, that batting average fell to only 35% following the 23 years in which the S&P set one or more new highs in July. And to add insult to injury, following the 13 Julys that set six or more new all-time highs, the S&P 500 declined an average 2.4% in August, and fell in price 12 of 13 times.”
Source: Fortune
Dr. Robert Genetski’s excerpts from ClassicalPrinciples.com
Market Outlook
Stocks moved broadly higher for the second straight week with all major indexes hitting all-time highs. Small caps also advanced, but remain 4%- 5% below their highs.
Stocks keep moving higher, behaving like the little engine that could. They are reaching a point above their 50-day average which often leads to at least a short-term correction. However, unprecedented monetary ease should continue to limit any downward correction.
Business surveys show July business activity continued to increase at a rapid rate. This raises the odds total spending (GDP) will grow at double-digit annual rates for the third consecutive quarter.
Investors ignored concerns surrounding Covid. As with the flu, Covid and its offspring variants will be with us for a while. Recent data from the US, Israel and the UK suggest the vaccine is not working as well as expected. Moderna appears to confirm this by announcing vaccinated people might need a booster after six months. Chaching!
The good news is the Association of American Physicians & Surgeons (AAPS) have very treatments for Covid, if begun in the early stages.
Unfortunately, the CDC, NIH continue to ignore the AAPS advice. They claim their job is to advise on limiting the spread of the disease, not providing medical advice.
In spite of the potential for a setback in stocks, equity portfolios should continue to maintain a relatively large percentage of stocks. With historically low interest rates, stocks remain very attractive.
A Look Back Today’s employment report shows July private payrolls rose by 703,000. In spite of the surge in jobs over the past six months, payrolls remain 4% below their pre-Covid peaks. The increase in jobs helped drive the unemployment rate down to 5.4%.
Stock Valuation: S&P 500 25% Overvalued
Economic Fundamentals: Positive
Monetary Policy; Highly Expansive
Source: Classical Principles.com
Listed below are some of the INDEXES for both the equities and interest rate markets. The source is Morningstar.com
Dow Jones +16.16%
S&P 500 +19.1%
EQUAL WEIGHTED S&P 500 +17.2%
NASDAQ Aggressive growth +16%
Large Cap Value +16%
I Shares Russell 2000 ETF (IWM) Small cap +14%
Midcap stock funds +17%
International Index (MSCI – EAFE ex USA +9.4%
International Emerging Markets +.90%
Financial stocks +29%
Energy stocks +33%
Healthcare Stocks +17%
High Yield Merrill Lynch High Yield Index +2.5%
Gold -5.2%
CHART SOURCE:AIQSYSTEMS.COM
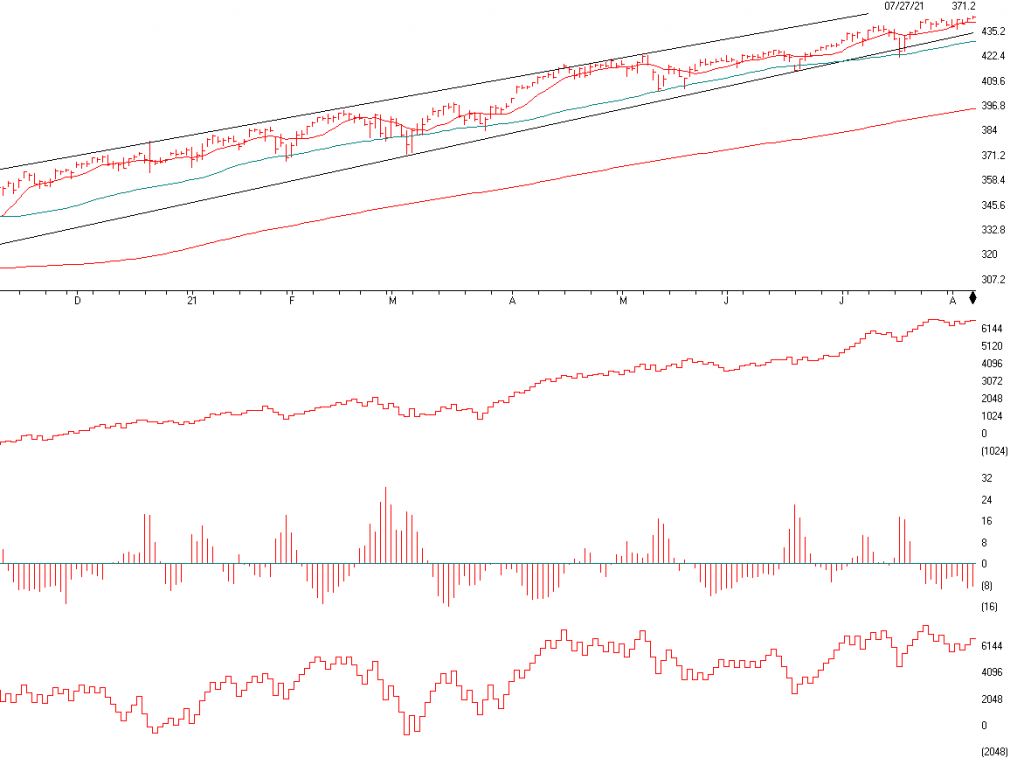
Above is the S&P 500. As you can see, it continues to rise on a Left to Right Pattern. Last month I said if it drops below the trend-line and the 50-day moving average on a close I would get very cautious. It went right to the 5o day moving average 30 minutes prior to the close and rallied 150 points to close nicely above the 50 day moving average and the trend-line. See the arrow My computer models are still flashing Sell signals which have not been confirmed, so this is a watch and wait and realize I might sell for many of you where I am the Fiduciary on the account. August to September is usually a tough time for the market.
If the trend-line or the 50-day moving average is broken on the close I will again become very cautious.
The chart below the market is money flow and that looks good. It shows that money is still going into the market
The next chart shows that the volume as the market is rising is going up on low volume. That is not great.
The chart on the bottom is called “On Balance Volume” and it confirms the upside of the market index if it were hitting a new high like the market has. As you can see it is not doing that as of Friday. So this is a Caution.
Overall, we could have a little correction from now till October. Watch the trend-lines and the 50 day moving average for a break on the close of the day.
Support levels on the S&P 500 area are 4370, 4315, 4300, and 4256.
These may be safer areas to get into the equity on support levels slowly on the accumulation areas.
THE BOTTOM LINE:
I am still relatively Bullish on the market, but as you can see above, the market is getting overvalued and August through October are seasonally weak for the market. My target of 4400 on the S&P 500 is pierced on the upside. At this point it could correct very soon then rally to the 4500+ by the end of the year after a little setback. The Value sector of the market and the mid and large value sectors are now fairly valued. Over the longer term, technology, up about 16% should perform the best. Trendlines are very important. At this point, I would not want to see the level broken convincingly on a close. That would make me get very cautious.
Best to all of you,
Joe Bartosiewicz, CFP®
92 High Street
Thomaston, CT 06787
Securities and advisory services offered through SagePoint Financial, Inc. (SPF), member FINRA/SIPC. SPF is separately owned and other entities and/or marketing names, products or services referenced here are independent of SPF. 800-552-3319 20 East Thomas Road Ste 2000 Phoenix AZ 85012
The price of commodities is subject to substantial price fluctuations of short periods and may be affected by unpredictable international monetary and political policies. The market for commodities is widely unregulated, and concentrated investing may lead to Sector investing may involve a greater degree of risk than investments with broader diversification.
Indexes cannot be invested indirectly, are unmanaged, and do not incur management fees, costs, and expenses.
Dow Jones Industrial Average: A weighted price average of 30 significant stocks traded on the New York Stock Exchange and the NASDAQ.
S&P 500: The S&P 500 is an unmanaged indexed comprised of 500 widely held securities considered to be representative of the stock market in general.
NASDAQ: the NASDAQ Composite Index is an unmanaged, market-weighted index of all over the counter common stocks traded on the National Association of Securities Dealers Automated Quotation System
(IWM) I Shares Russell 2000 ETF: Which tracks the Russell 2000 index: which measures the performance of the small capitalization sector of the U.S. equity market.
A Moderate Mutual Fund risk mutual has approximately 50-70% of its portfolio in different equities, from growth, income stocks, international and emerging markets stocks to 30-50% of its portfolio in different categories of bonds and cash. It seeks capital appreciation with a low to moderate level of current income.
The Merrill Lynch High Yield Master Index: A broad-based measure of the performance of non-investment grade US Bonds
MSCI EAFE: the MSCI EAFE Index (Morgan Stanley Capital International Europe, Australia, and Far East Index) is a widely recognized benchmark of non-US markets. It is an unmanaged index composed of a sample of companies’ representative of the market structure of 20 European and Pacific Basin countries and includes reinvestment of all dividends.
Investment grade bond index: The S&P 500 Investment-grade corporate bond index, a sub-index of the S&P 500 Bond Index, seeks to measure the performance of the US corporate debt issued by constituents in the S&P 500 with an investment-grade rating. The S&P 500 Bond index is designed to be a corporate-bond counterpart to the S&P 500, which is widely regarded as the best single gauge of large-cap US equities.
Floating Rate Bond Index is a rule-based, market-value weighted index engineered to measure the performance and characteristics of floating-rate coupon U.S. Treasuries, which have a maturity greater than 12 months.