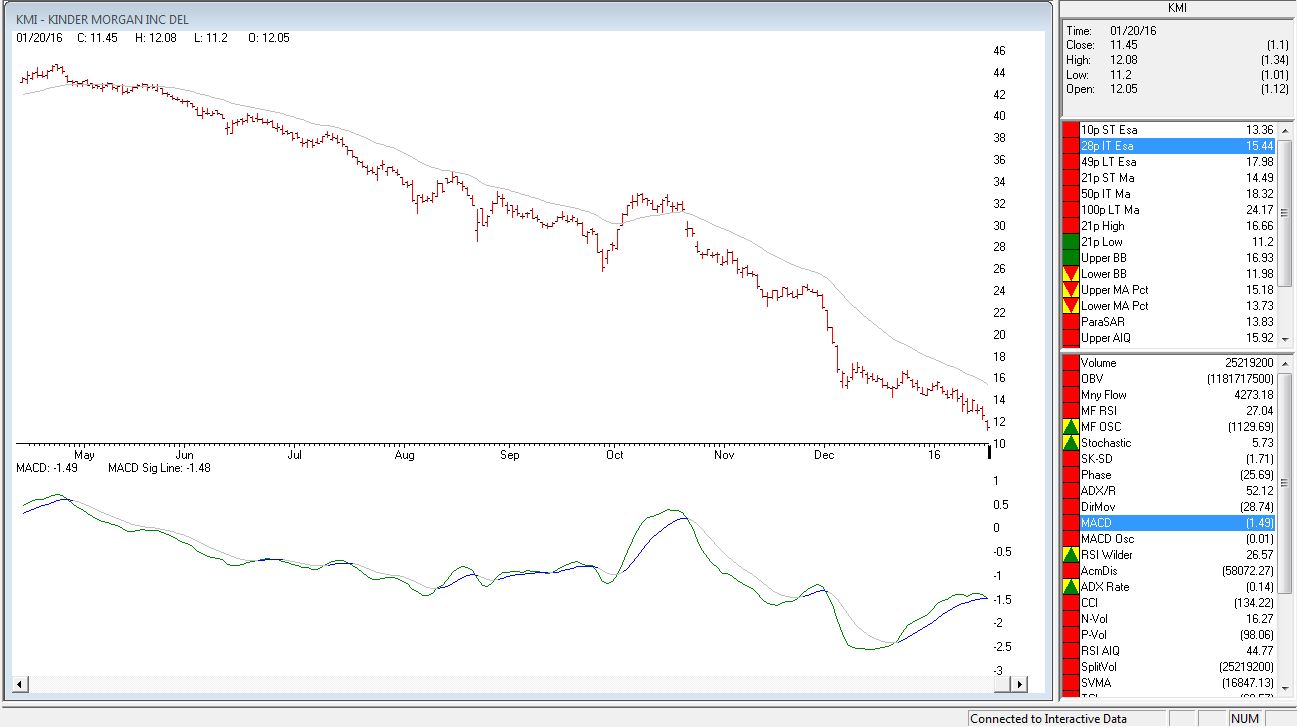
All posts by admin

Professor’s Comments December 17, 2014

Once again, the Dow rallied early for almost 250 points, only to finish down 111 points at 17,069.  It was the second consecutive day where the market could not hold its large early gains.  I don’t  remember ever having seen two days of trading with such severe intraday volatility.  Volume was heavy, coming in at 126 percent of its 10-day average.  There were 23 new highs and 434 new lows.
The Fed will conclude its 2-day FOMC Meeting today and will be announcing its decision on interest rate policy at 2pm.  I find it hard to get excited about the Fed anymore, but there appears to be a lot of interest in whether the words ‘for a considerable time’ will be dropped from the statement.
Last night the A-D oscillator came in with another EXTREME reading.  However this time the reading of -253.67 was not only extremely oversold, it also represented a small change from the previous day’s reading of -281.6.  As I mentioned yesterday, markets usually rally within 1-2 days of EXTREME readings like this, the exception being when a crash is taking place. So now with a small change reading from the A-D oscillator, we need to be on the look out for another Big Move.
The Dean’s List, Tide, and cockpit indicators remain negative.  As long as these indicators stay negative, I will continue to look for opportunities to short the market. 
So far the decline since 8 December has been almost straight down.  There has only been one winning session in the past 7 trading days.  And most of the declining days have been characterized by moves over 100 points.  That’s too much decline to fast, even if a crash is taking place.  The market should start to find a bottom somewhere between current levels and 16,850 and rally. It’s likely that this rally will be wave 2 up. 
The seasonality also supports a rally.  The time between now and the end of the year is usually very Bullish.  The only time that it has not been Bullish recently is when some type of government imposed ‘cloud’, has been placed on the markets.   However now that the House has passed a spending Bill to keep the government running into late next year, this shouldn’t be an issue.
So if the market reacts positively to the Fed announcement, it is very likely that a significant rally could develop from current levels and carry into early next year.  Like I said above…this market is EXTREMELY oversold now.  I still believe that the market will trade below the 16,800 level and likely a LOT lower.  But remember, it will likely NOT fall straight down.  There will have to be retracement rallies along the way.  And right now, all of the conditions are in place for a rally to start, either from current levels or from levels closer to 16,850 which is now only about 200 points away.
Here’s the thing:  IF the market does start to rally, the odds are overwhelming that the rally will not retrace all the way back to the 5 December high of 17,991.  However a 50 percent rally back to 17,530 is very likely.  This assumes that wave 1 down bottomed yesterday at 17,067.  If the Dow continues to fall after today’s Fed announcement, this retracement level will have to be adjusted accordingly.
The thing I will be watching is The Tide.  As long as The Tide remains negative, I will be looking to fade rallies above 17,427.
I will also be watching energy stocks like Halliburton (HAL) and Schlumberger (SLB)  for possible scalp trades on the shorter term bars.  Halliburton at 38 is EXTREMELY oversold.  The HS pattern suggests a target closer to the 32 level, however before that can happen, it’s likely the stock will bounce several points higher before the next leg down begins, probably in January.  This is not a trade for the risk adverse, but the downside momentum appears to be waning and is even showing positive divergence.  Energy stocks have led the market lower.  If the market does start a wave 2 retracement rally, I would expect the beaten down energy stocks to lead the way.  Remember…scalp trades only!  No holding overnight.
I should also mention one other thing.  Today is 17 December.  In other words, there are now only 8 days before Christmas and 15 days before the new year.   Yeah, this is a usually a Bullish time.  But you don’t have to trade it.  If you made a few bucks by following The Tide and my Lists, you might want to take some time off and enjoy the Holliday season.  I don’t think you’re gonna miss much in the next 2-weeks.  If the market does start a wave 2 rally, remember, all of the up-down-up action of a wave 2  will make it very difficult to trade.
During the past week, we’ve been trading an impulse wave to the downside.  The odds were high and in our favor.  But now that the Dow has fallen over 900 points, the odds for additional decline in the short term have decreased.  And IF the market does start a wave 2 retracement rally, the low odds you get with counter trend trades can make you wonder why you’re doing them.   So maybe the better thing to do is to take some time off and relax.  Take some time to think about what you did right and wrong during the wave 1 decline.  By reviewing your trades, it might help you become better prepared to attack the markets early next year, when the odds will likely be more favorable.  Remember, you should NOT trade all the time; only when the odds are in your favor.
Waiting for the Fed announcement.
That’s what I’m doing,
Hank Swiencinski, AIQ TradingExpert Pro user and founder, One Minute Stock http://oneminutestock.com
Market Signals for 
12-17-2014
DMI (DIA) NEG
DMI (QQQ) NEG
COACH (DIA) NEG
COACH (QQQ) NEG
A/D OSC SM CHG
DEANs LIST NEG
THE TIDE NEG

All of the commentary expressed in this site and any attachments are opinions of the author, subject to change, and provided for educational purposes only. Nothing in this commentary or any attachments should be considered as trading advice. Trading any financial instrument is RISKY and may result in loss of capital including loss of principal. Past performance is not indicative of future results. Always understand the RISK before you trade.

Seasonal E-mini Strategy – 42 Wins and 0 Losses?

Don’t you just hate titles like this one?  I mean if you are into the stock market you almost can’t help but to click on it – even if for no other reason than to seek the answer to that age old question, “What’s the catch?”

Now in this case the title is accurate, at least in the hypothetical sense.  But as you probably know, for any book, article or publication the name is everything.  For example, if the title of this article were “Would You Be Willing to Risk $3,000 on a Trade for the Chance of Making as Little as $25 on Said Trade?” (which would also be hypothetically accurate), you would be a lot less likely to click on the link, right?  I mean let’s be honest here.

So, yes, technically you can’t judge a book (article or publication) by its cover.  But in reality, we all do it all the time.  So just remember that  the people designing the covers have a vested interest in getting you to open the cover, so be forewarned.

Hence the title of this article.  But since you’ve already “cracked open the cover”, why not read on a little further?  (Insidious, no?)

A Seasonal Oversold “Idea”
Note the use of the word “Idea” in the section title.  And also please remember that the word “idea” is quite different from the words “sure” and/or “thing” and way different from the phrase “you can’t lose.”  So again, be forewarned.  In the interest of full disclosure I am not attempting to urge you to use the “idea” spelled out below – only to be “aware” of it and to consider whether or not it might “fit your style.”

So what’s this all about?  Simple.  Awhile back I wrote a piece titled “Happy Days are Here, Um, Next Monday?” that in a nutshell highlighted the fact that the stock market tends to perform well between the close of trading on the Friday before Thanksgiving and the close of the third trading day of the following January.  The “idea” in this article builds from that trend.

Entry Rules
Here are the “rules” (to paraphrase the immortal words of Bill Murray, they are really “guidelines” more than “rules”, but here goes):

*If today is between (and including) the Friday before Thanksgiving and the third trading day of the New Year, AND;
*The 2-day RSI is below 30, a “buy alert” is signaled.
*After a “buy alert” occurs, a “buy signal” occurs when the E-mini S&P 500 exceeds a previous day’s high price (however, a “buy signal” cannot occur after the third trading day of January).

Exit Rules (OK, again – Guidelines):
*Sell if the E-mini S&P declines 60 (i.e., $3,000 per contract) points from the buy trigger price (i.e., the previous day’s high + 0.25 points), OR
*On the first profitable close.

Results
Starting in November 2004 there have been 42 trades.  During this time there have been no post buy declines of 60 points (although a few have come close), hence the reason no losing trades.
Figure 1 displays the most recent signal using the December 2014 E-mini S&P 500 contract.

es-ss 1 
Figure 1 – Seasonal Oversold Trade for 2014-2015 (so far); Source: AIQ TradingExpert

Figure 2 displays the trades from the 2013-2014 periods.

es-ss2
Figure 2 – Seasonal Oversold Trade for 2013-2014 (Source: AIQ TradingExpert)

Figure 3 displays the trades from the 2012-2013 periods.

es-ss3

Figure 3 – Seasonal Oversold Trade for 2012-2013 (Source: AIQ TradingExpert)

Figure 4 displays the trades signaled each year during the bullish seasonal period (assuming a 1-lot per trade).

Trade # Entry Date Exit Date Buy Price Sell Price Points +(-) per Trade $ +(-) per Trade MaxDD Pts. per Trade MaxDD $ per Trade
1 11/23/04 11/24/04 1179.25 1182.00 2.75 $137.50 (7.75) ($388)
2 12/01/04 12/01/04 1179.75 1189.75 10.00 $500.00 (4.75) ($238)
3 12/09/04 12/09/04 1187.00 1190.75 3.75 $187.50 (11.25) ($563)
4 12/20/04 12/21/14 1203.75 1208.00 4.25 $212.50 (8.50) ($425)
5 12/01/05 12/01/05 1263.25 1264.50 1.25 $62.50 (11.50) ($575)
6 12/12/05 12/13/05 1272.75 1277.00 4.25 $212.50 (9.00) ($450)
7 12/21/05 12/22/05 1272.25 1275.50 3.25 $162.50 (5.50) ($275)
8 01/03/06 01/03/06 1259.25 1274.75 15.50 $775.00 (7.75) ($388)
9 11/29/06 11/29/06 1392.75 1402.25 9.50 $475.00 (0.50) ($25)
10 12/11/06 12/14/07 1428.00 1438.25 10.25 $512.50 (11.00) ($550)
11 12/27/06 12/27/06 1431.25 1437.00 5.75 $287.50 (0.25) ($13)
12 11/23/07 11/28/07 1440.00 1442.00 2.00 $100.00 (33.25) ($1,663)
13 11/26/07 11/28/07 1444.25 1470.50 26.25 $1,312.50 (37.50) ($1,875)
14 11/28/07 11/28/07 1441.25 1470.50 29.25 $1,462.50 (0.25) ($13)
15 12/05/07 12/05/07 1478.00 1487.00 9.00 $450.00 (1.25) ($63)
16 12/19/07 12/20/07 1471.75 1474.75 3.00 $150.00 (16.00) ($800)
17 11/24/08 11/24/08 814.50 848.00 33.50 $1,675.00 (7.25) ($363)
18 12/03/08 12/03/08 851.00 868.50 17.50 $875.00 (24.75) ($1,238)
19 12/16/08 12/16/08 885.50 912.75 27.25 $1,362.50 (9.75) ($488)
20 12/26/08 12/29/08 870.00 870.50 0.50 $25.00 (16.75) ($838)
21 11/23/09 11/23/09 1102.50 1103.75 1.25 $62.50 (1.25) ($63)
22 12/01/09 12/01/09 1104.75 1108.50 3.75 $187.50 (2.50) ($125)
23 12/04/09 12/22/09 1112.25 1113.50 1.25 $62.50 (3.75) ($188)
24 12/10/09 12/11/09 1097.75 1103.25 5.50 $275.00 (5.25) ($263)
25 12/21/09 12/22/09 1107.75 1108.25 0.50 $25.00 (11.25) ($563)
26 01/04/10 01/04/10 1124.25 1128.75 4.50 $225.00 (4.75) ($238)
27 11/24/10 12/01/10 1187.75 1196.50 8.75 $437.50 (11.50) ($575)
28 12/01/10 12/01/10 1197.50 1204.50 7.00 $350.00 (0.50) ($25)
29 12/16/10 12/21/10 1244.50 1250.75 6.25 $312.50 (12.00) ($600)
30 01/03/11 01/03/11 1258.50 1265.25 6.75 $337.50 (3.25) ($163)
31 11/28/11 11/28/11 1174.50 1191.00 16.50 $825.00 (5.25) ($263)
32 12/09/11 12/09/11 1250.50 1253.00 2.50 $125.00 (17.75) ($888)
33 12/15/11 12/20/11 1218.75 1236.00 17.25 $862.50 (23.25) ($1,163)
34 12/20/11 12/20/11 1218.75 1236.00 17.25 $862.50 (20.00) ($1,000)
35 12/30/11 01/03/12 1258.75 1272.00 13.25 $662.50 (8.00) ($400)
36 12/05/12 12/06/12 1412.00 1413.00 1.00 $50.00 (15.25) ($763)
37 12/17/12 12/17/12 1419.50 1427.00 7.50 $375.00 (10.25) ($513)
38 12/26/12 01/02/13 1424.75 1457.00 32.25 $1,612.50 (42.50) ($2,125)
39 12/31/12 12/31/12 1417.00 1420.00 3.00 $150.00 (33.50) ($1,675)
40 12/06/13 12/06/13 1794.50 1803.75 9.25 $462.50 (8.75) ($438)
41 12/16/13 12/16/13 1783.25 1786.00 2.75 $137.50 (17.75) ($888)
42 12/02/14 12/02/14 2061.25 2066.00 4.75 $237.50 (10.50) ($525)
Points $ Points $
Average 9.32 $466 (11.74) ($587)
Median 6.00 $300 (9.38) ($469)
Max 33.50 $1,675 (0.25) ($13)
Min 0.50 $25 (42.50) ($2,125)

Figure 4 – Hypothetical Trade-by-Trade Results

A few things to note:

*42 winners, 0 losers
*Maximum drawdown per 1-lot = -$2,125
*Average winner in points (dollars) = +9.32 (+$466)
*Median winner in points (dollars) = +6.00 ($300)
*Average Maximum drawdown per trade in points (dollars) = -11.74 (-$587)
*Median Maximum drawdown per trade in points (dollars) = -9.38 (-$469)

Summary
So on the face of it, anything that is capable of generating 42 consecutive winning trades would seem to have some merit to it.  On the other hand, with any trading method it is critically important to look “under the hood” and make some realistic assessments regarding the actual usefulness of said method.

The system rules include a 60 point stop-loss for the E-mini S&P 500 futures contract.  At $50 a point, this equates to a potential loss of $3,000 per contract per trade.  The average dollar profit was only $466 and the median dollar profit per trade was $300.

The key elements of risk in this method then are:

1) One losing trade of $3,000 could require a number of trades to come back from.
2) Using a tight stop-loss will result in a number of losing trades that would ultimately have ended up winners.

So the question for a trader to ask is – can we judge this book by its cover?

Jay Kaeppel  
Chief Market Analyst at JayOnTheMarkets.com and AIQ TradingExpert Pro (http://www.aiq.com) client
http://jayonthemarkets.com/

Jay has published four books on futures, option and stock trading. He was Head Trader for a CTA from 1995 through 2003. As a computer programmer, he co-developed trading software that was voted “Best Option Trading System” six consecutive years by readers of Technical Analysis of Stocks and Commodities magazine. A featured speaker and instructor at live and on-line trading seminars, he has authored over 30 articles in Technical Analysis of Stocks and Commodities magazine, Active Trader magazine, Futures & Options magazine and on-line at www.Investopedia.com.

Three Sector Funds for December

December has historically been a bullish month for the stock market. In fact, over the past 24 years, buying and holding an S&P 500 Index fund during the month of December would have netted a gain 20 times, or 83.3% of the time, with an average gain of almost +2% (+1.93% actually).  A lot of investors might be tempted to say “That’s good enough for me”, and who could blame them?
But there might be a way to do even better.

Certain sectors show historical tendencies to perform well during certain times of the year.  So let’s look at a simple 3 fund portfolio that has performed quite a bit better than the S&P 500 over the past 24 years.

The “December Three”
The three sectors are Biotech, Software and Home Construction.  Figure 1 displays some potential trading vehicles.

Sector Fidelity ETF
Biotech FBIOX IBB
Software FSCSX VGT
Home Construction FSHOX XHB

Figure 1 – Fidelity and ETFs


Results
For testing purposes we will use the Fidelity funds listed in Figure 1 as they have historical data going back much further than the ETFs listed.

Figure 2 displays the annual result of a portfolio split evenly between the three funds versus the S&P 500 Index.

Fid 3

Figure 2 – Annual Results: 3 Fidelity Sector Funds vs. SPX

Figure 3 displays the growth of $1,000 invested only during the month of December in the “Fidelity 3” versus the S&P 500 Index.

 Fid 3 chart

 
Figure 3 – Growth of $1,000 invested in Fidelity 3 versus SPX (1990-2013)

Figure 4 displays the relevant comparative figures.

 fid 3 results

 
Figure 4 – Comparative Results

A few things to note:

*The Fidelity 3 has gained an average of +4.21% versus +1.93% for SPX.
*The Fidelity 3 median gain was +2.52% versus +1.25% for SPX.
*The Fidelity 3 has showed a higher standard deviation, but also a *higher Average/Standard Deviation.
*The worst December for the Fidelity 3 was -4.99% versus -6.03% for SPX.
*Interestingly, the Fidelity 3 has been up 19 times and down 5, versus up 20 and down 4 for SPX. 

However – and most importantly – the Fidelity 3 has outperformed SPX in 18 of the past 24 years.

Summary
So are biotech, software and home construction guaranteed to show a gain and outperform the S&P 500 this December.  Not at all. But for an investor looking to “beat the market”, it certainly is “food for thought.”

Jay Kaeppel  
Chief Market Analyst at JayOnTheMarkets.com and AIQ TradingExpert Pro (http://www.aiq.com) client
http://jayonthemarkets.com/

Jay has published four books on futures, option and stock trading. He was Head Trader for a CTA from 1995 through 2003. As a computer programmer, he co-developed trading software that was voted “Best Option Trading System” six consecutive years by readers of Technical Analysis of Stocks and Commodities magazine. A featured speaker and instructor at live and on-line trading seminars, he has authored over 30 articles in Technical Analysis of Stocks and Commodities magazine, Active Trader magazine, Futures & Options magazine and on-line at www.Investopedia.com.

It’s a bullish time of year

Some call it a “Santa Claus Rally” or
“Year-End Rally.”  Others call
it an early “January Effect.”  Whatever
the name, we just entered a bullish seasonal period for equities.  Jay Kaeppel, author of Seasonal Stock Market Trends, crunched the numbers to demonstrate
the bullish market tendencies surrounding the Thanksgiving to New Year’s
holiday season.  Here are the results:

            The bullish
period starts the Monday before Thanksgiving and ends the third trading day in January.  Since 1949, the Dow Jones Industrial Average
was up on 54 occasions, or 83 percent of the time during the this period.  Even more bullish, the trading period
witnessed a gain in 27 of the last 29 years! 
The average gain was 3.2 percent while the median gain was 3.1
percent.  The largest gain was 13.9
percent in 1991-92.  The worst period was
-3.7 percent in 1977-78.         

            What does
this mean for portfolio returns?  If you
invested $1000 in the Dow only during the bullish period (Monday before Thanksgiving
to third trading day in January) the portfolio would now be $7400.  That’s very good, especially since this
assumes you make no money from January to mid-November of every year.

            Does this
mean stocks will rally in the seasonal period we just entered?  Investing in seasonal patterns is a bet on
odds or probabilities and this year stocks entered the period right after a
monster rally.  While history shows
losses can occur, the statistics point toward higher stock prices between now
and early January.  That’s fine by me!


 — David Vomund is an Incline Village-based fee-only money
manager.  Information is found at www.ETFportfolios.net or by calling 775-832-8555.  Clients hold the positions mentioned in this
article.  Past performance does not
guarantee future results.  Consult your
financial advisor before purchasing any security. 

Happy Days Are Here, Um, Monday?

It is not a little known fact that historically the action of the stock market has been relatively favorable both around holidays and towards the end of the year.  But some question remains as to just how favorable things have been during these periods and how often.  So let’s address it.

The Year-End (or “Santa Claus”) Rally
Different analysts will look at historical data and draw different conclusions.  This is actually a good thing, otherwise everyone would be trying to buy or sell at the same time.

But in the opinion one analyst (“Hi, my name is Jay”) the “year-end rally” period (or as I like to call it the “Santa Claus Rally”):

*Starts on the Monday before Thanksgiving
*Ends at the close of the third trading day of the following January

Have I mentioned lately that this stuff doesn’t need to be rocket science?

So how has this period performed?  We will start our test at the close of trading on Saturday (yes, Saturday) November 19, 1949 and examine what would have happened to a hypothetical $1,000 investment in the Dow Jones Industrials Average that was in the market only during the bullish year-end period described above (in other words, the trader would buy the Dow Industrials Average at the close on the last trading day prior to the Monday before Thanksgiving and would hold through the close of the third trading day of the following January.  The rest of the time the “system” is out of the market.  For our purposes, no interest is earned so as to reflect only the gains made during the bullish year-end period).

The results appear in chart form in Figure 1.santa rally
Figure 1 – Growth of $1,000 invested in the Dow Industrial Average only during the bullish year-end period described in text

Figure 2 displays the annual year-by-year results in table form.

Exit Date
% +(-)
1/5/50
3.6
1/4/51
4.0
1/4/52
3.9
1/6/53
4.6
1/6/54
2.9
1/5/55
5.1
1/5/56
0.2
1/4/57
3.7
1/6/58
(0.0)
1/6/59
5.7
1/6/60
5.8
1/5/61
3.2
1/4/62
(1.0)
1/4/63
5.0
1/6/64
8.2
1/6/65
(1.2)
1/5/66
3.0
1/5/67
(0.5)
1/4/68
4.3
1/6/69
(3.1)
1/6/70
(2.4)
1/6/71
10.0
1/5/72
11.6
1/4/73
3.4
1/4/74
(1.2)
1/6/75
3.6
1/6/76
6.0
1/5/77
3.1
1/5/78
(3.7)
1/4/79
3.6
1/4/80
1.6
1/6/81
1.5
1/6/82
0.9
1/5/83
2.3
1/5/84
2.5
1/4/85
(0.3)
1/6/86
5.7
1/6/87
4.3
1/6/88
6.5
1/5/89
6.2
1/4/90
5.4
1/4/91
0.6
1/6/92
13.9
1/6/93
2.4
1/5/94
2.8
1/5/95
0.9
1/4/96
3.7
1/6/97
1.5
1/6/98
0.3
1/6/99
4.2
1/5/00
1.1
1/4/01
2.7
1/4/02
4.0
1/6/03
(0.4)
1/6/04
9.5
1/5/05
1.3
1/5/06
1.1
1/5/07
0.4
1/4/08
(2.9)
1/6/09
12.0
1/6/10
2.5
1/5/11
4.6
1/5/12
5.3
1/4/13
6.7
1/6/14
1.6
Figure 2 – Year-by-Year “Santa Claus Rally” % +(-)


A few performance notes:
# times UP = 54 (83% of the time)
# times DOWN = 11 (17% of the time)
Average% +(-) = +3.19%
Median % +(-) = +3.08%
Largest % Gain = +13.87% (1991-92)
Largest % Loss = (-3.69%) (1977-78)

It is also worth noting that the year-end rally period has witnessed a gain for the Dow in 27 of the last 29 years and 33 of the last 36 years.

Summary
So do the results displayed in Figures 1 and 2 guarantee that the stock market is destined to rally in the near future?  Ah there’s the rub.  For the answer is “not necessarily”.  Still, investing is in many ways a game of odds and probabilities.  While one always needs to be prepared to act defensively if things start to go south, history suggests that traders and investors might do well to give the bullish case the benefit of the doubt between Thanksgiving Week and early January 2015.

Or to put it more succinctly:
Jay’s Trading Maxim #215: Santa Claus is real (approximately 83% of the time).

Jay Kaeppel  
Chief Market Analyst at JayOnTheMarkets.com and AIQ TradingExpert Pro (http://www.aiq.com) client
http://jayonthemarkets.com/

Jay has published four books on futures, option and stock trading. He was Head Trader for a CTA from 1995 through 2003. As a computer programmer, he co-developed trading software that was voted “Best Option Trading System” six consecutive years by readers of Technical Analysis of Stocks and Commodities magazine. A featured speaker and instructor at live and on-line trading seminars, he has authored over 30 articles in Technical Analysis of Stocks and Commodities magazine, Active Trader magazine, Futures & Options magazine and on-line at www.Investopedia.com.