Volume was on the heavy side, coming in at 123 percent of its 10-day average. There were 38 new highs and… 378 new lows.
In yesterday’s comments I talked about how the market would likely stair-step its way lower and how rallies would likely turn into shorting opportunities. We saw this occur yesterday.
FREE Weekend strategy review delivered to inbox every week
The Dean’s List remains negative and the Tide continues to go out. Do not attempt to fight the Tide.
The reason I say this is because I’m seeing a lot of institutional selling now.
The Big Boys are dumping stock!
How do I know?
Well, there’s a dead giveaway. If you have been watching the market action for the past week, you have seen that most of the selling is taking place late in the day. That’s when the institutions sell stocks. Most of their selling usually takes place during the last hour of trading.
As a matter of fact, some technicians have even developed an indicator to monitor this selling. It’s called the Last Hour Indicator. It breaks breaks down the selling into hourly increments so institutional trading can be monitored. But you don’t need a fancy indicator to do this. Just watch the trading in the last hour. If the Dow is falling into the close, then you know the institutions are likely behind it.
And why is this important? Hmmm?
Well, it’s one thing if the retail investors are selling a declining market. This is what usually causes the ‘dips’ to form in a Bull Market. Retail selling usually creates buying opportunities for the Big Boys.
But when it’s the Big Boys who are selling stock in a declining market, it’s almost always a sign that there is BIG trouble ahead. The fact that they are selling and not buying now means the market will likely have trouble finding bids. And without bids, small declines can turn into BIG ones very quickly!
So we need to be extremely careful now.
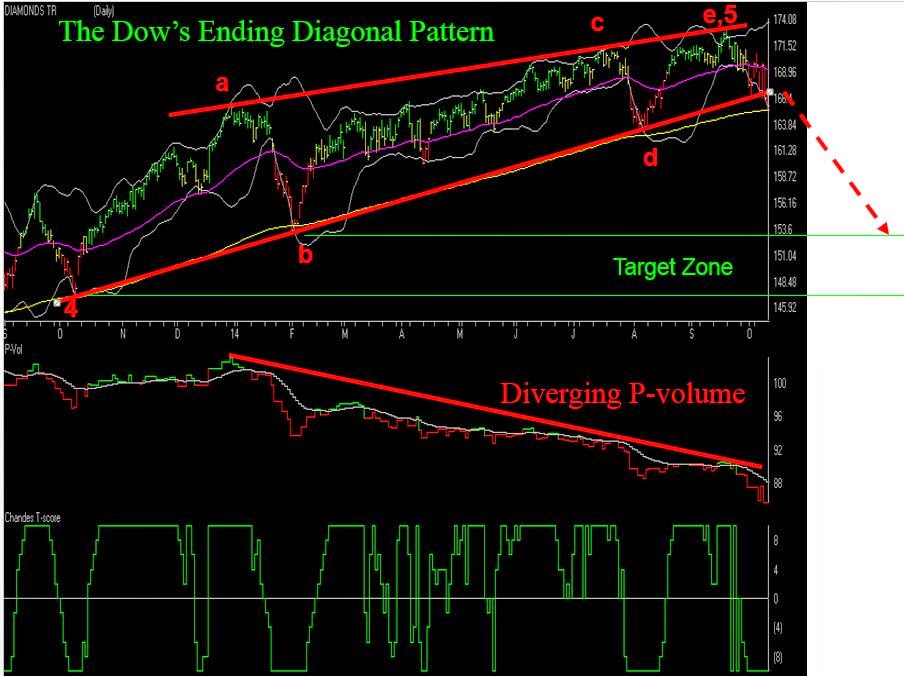
Now that prices have broken out of the Major Ending Diagonal Pattern, it is likely that the Dow will continue to decline into the end of October.
The next major support level for the Dow, which is the February 2014 low of 15,340, is still over 1,000 points away. You might want to look at the chart of the Dow I posted last weekend to review the ‘target zones’. The 15,340 level is the upper level of the zone. Prices could go a lot lower!
As long as the Dean and the Tide stay negative, the institutional selling will likely continue to drop the market to lower levels. The decline won’t be straight down, but the rallies will be brief…like the one we saw yesterday.
During yesterday’s rally, I bought an initial position in SKF, the inverse financial ETF. The ETF has a classic TLB pattern and is on the Dean’s List with positive PT indicators. It satisfies all of the elements of the SIGN.
The thing that caused me to add SKF to the mix was the positive and diverging P-volume.
Once again, I’m not in love with SKF. It’s just a ‘date’. And when I buy something with a TLB pattern, I am now committed to hold it until one of two things happens. Either the ETF ‘Jumps the Ropes’ and starts the reversal process, or the PT indicators turn negative. One or the other. That’s it.
If the ETF makes a ‘Rope Jump’, I’ll start managing my money in anticipation of a wave 2 pullback. If the PT indicators turn negative, the ‘date’ is over.
BTW, I also bought back a few shares of TWM during yesterday’s rally. The P-volume continues to impress, but once again the ETF appears overbought. If the rally in TWM continues today, I’ll likely take a few bucks off the table. The 50 still has not crossed above the 200 and I never like to be holding a full position when the ETF is technically still in a down trend.
Holding inverse ETFs from the Dean’s List.
That’s what I’m doing.
Hank Swiencinski, aka The Professor, is founder of http://OneMinuteStock.com and teaches the One Minute Stock course at UNF in Jacksonville, FL. Hank uses TradingExpert Pro extensively in his analysis.
FREE Weekend strategy review delivered to inbox every week