Hi, my name is Jay and I am a Seasonalaholic.
Now typically when someone confesses to being an “aholic” of some sort or another it because they recognize they have a problem and wish to correct it. That’s not the case here. In fact the “support” group that I belong to is not “Seasonalaholics Anonymous” but rather “Seasonalaholics Unanimous!” (OK, in the interest of full disclosure, so far I am the only member and yes, the monthly meetings aren’t terribly lively, but I digress).
Still I can’t help but think there are others out there who might join someday – especially after they consider things like the seasonal tendencies for retailing stocks. To whit: what would have happened had an investor invested in Fidelity Select Sector Retailing fund (ticker FSRPX):
-During the months of February, March, October and November
-And then earned 1% of annualized interest while out of the market the other 8 months.
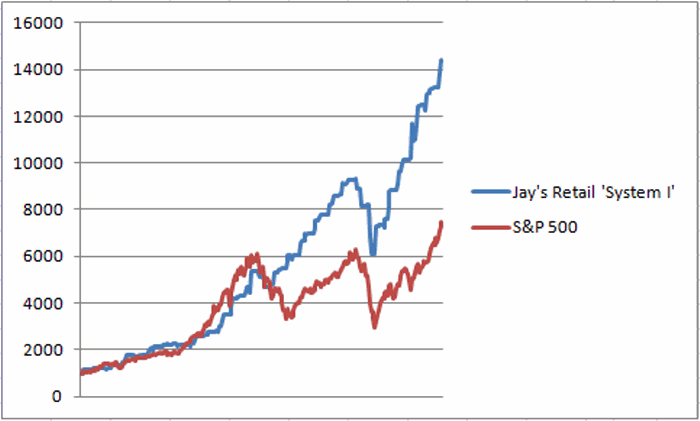
The answer is contained in Figure 1 which displays the growth of $1,000 invested as described above.
 Figure 1 – Growth of $1,000 invested in FSRPX during February, March, October, November (blue line) versus buying and holding the S&P 500 red line) since January 1988.
Now it is pretty impossible to not notice the, ahem, “slight drawdown” experienced during the October, November 2008 period. Still, despite the fact that I have tried very hard scrub that particular time period from my memory bank, I still have some vague recollection that virtually no sector of the stock market was left unscathed during that period. And the rebound has been pretty nice.
So is this really a viable strategy? Well, under the category of “Everything is Relative”, Figure 2 displays the year-by-year performance of this “system” versus buying and holding the SP 500.
| System | SP 500 | System | SP 500 | ||
| Annual % | Annual % | Difference |
$1,000
|
$1,000
|
|
|
1988
|
18.6
|
12.4
|
6.2
|
1,186
|
1,124
|
|
1989
|
(1.0)
|
27.3
|
(28.2)
|
1,174
|
1,430
|
|
1990
|
21.3
|
(6.6)
|
27.8
|
1,424
|
1,336
|
|
1991
|
16.2
|
26.3
|
(10.1)
|
1,654
|
1,688
|
|
1992
|
20.4
|
4.5
|
15.9
|
1,992
|
1,763
|
|
1993
|
6.2
|
7.1
|
(0.9)
|
2,115
|
1,888
|
|
1994
|
(1.5)
|
(1.5)
|
0.0
|
2,083
|
1,859
|
|
1995
|
2.3
|
34.1
|
(31.8)
|
2,131
|
2,493
|
|
1996
|
17.4
|
20.3
|
(2.9)
|
2,500
|
2,998
|
|
1997
|
11.9
|
31.0
|
(19.1)
|
2,798
|
3,927
|
|
1998
|
40.1
|
26.7
|
13.4
|
3,919
|
4,975
|
|
1999
|
10.8
|
19.5
|
(8.7)
|
4,344
|
5,946
|
|
2000
|
8.5
|
(10.1)
|
18.7
|
4,714
|
5,343
|
|
2001
|
3.1
|
(13.0)
|
16.1
|
4,859
|
4,646
|
|
2002
|
12.8
|
(23.4)
|
36.2
|
5,480
|
3,561
|
|
2003
|
9.1
|
26.4
|
(17.3)
|
5,977
|
4,500
|
|
2004
|
12.8
|
9.0
|
3.8
|
6,744
|
4,905
|
|
2005
|
8.5
|
3.0
|
5.5
|
7,316
|
5,052
|
|
2006
|
9.2
|
13.6
|
(4.4)
|
7,991
|
5,740
|
|
2007
|
(2.4)
|
3.5
|
(6.0)
|
7,797
|
5,943
|
|
2008
|
(32.0)
|
(38.5)
|
6.5
|
5,303
|
3,656
|
|
2009
|
23.7
|
23.5
|
0.2
|
6,559
|
4,513
|
|
2010
|
26.0
|
12.8
|
13.2
|
8,263
|
5,090
|
|
2011
|
13.2
|
(0.0)
|
13.2
|
9,355
|
5,090
|
|
2012
|
17.3
|
13.4
|
3.9
|
10,976
|
5,772
|
|
2013
|
10.7
|
29.6
|
(18.9)
|
12,155
|
7,481
|
| Average |
10.9
|
9.6
|
1.3
|
+1,115% | 648% |
| StdDev |
12.8
|
17.9
|
|||
| Ave/SD |
0.849
|
0.540
|
Summary
The difference in the average annual return is not large (+10.9% for the system versus +9.6% for the S&P 500). But this difference adds up over time. Since January 1988 the system has gained +1,115% versus + 648% for the S&P 500 (while only being in the market 33% of the time. The true “numbers geeks” will notice that the standard deviation of annual returns for the system is only 2/3rds as large as that for the S&P 500 – i.e., much less volatility).
So I ask again, is this really a viable strategy? Perhaps. But the truth is that it can get a whole lot better – as I will detail the next time I write.
Jay Kaeppel

