Some seasonal trends have shown a tendency to persist through time (hence the use of the word “trend”, I guess). As it turns out we are at the cusp of one of “those times” right now. It is sitting there like a wrapped gift under the tree with our name on it – so let’s not waste any time diving in.
December-January Changeover
The period we will look at encompasses the last 4 trading days of December and the first 3 trading days of the following January. In other words, a contiguous 7 day trading period during which the stock market has showed a tendency to behave in a bullish manner.
Now given the persistence of the recent market run up, many may be a little leery of diving in here. Which I understand. Still, the numbers are what they are, so let’s take a look.
The Test
So as not to make it easy on ourselves, this test begins in December 1933, i.e., in the early days off the great Depression. We will buy the Dow Jones industrials Average at the close of the fifth to last trading day of the year and sell at the close of the third trading day of January. This test assumes no interest is earned while out of the market so that we measure only the performance during the supposedly bullish period.
The Results
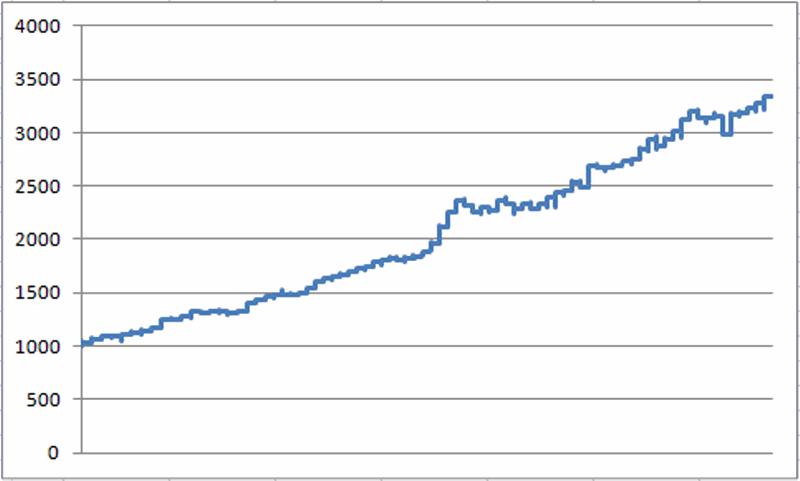
Figure 1 displays the growth of $1,000 invested in the Dow every year since 1933 during the seven trading days just described.
Two anecdotal comments from a quick perusal of the graph in Figure 1:
-There is clearly a lower left to upper right trend, which is what we want to see in any equity curve
-It is by no means “perfect”, so a little closer analysis of the numbers may be useful in convincing ourselves that this trend might actually be useful. So in order to gain some perspective, let’s compare the performance of the Dow during this time period versus Dow performance for all trading days.
A few figures of note:
-System average daily performance is +0.22% versus +0.03% for all trading days (7.53 times greater).
-System median daily performance is +0.17% versus +0.03% for all trading days (4.00 times greater).
-338 out of 560 system trading days showed a gain (60.4%).
-10,946 out of all 20,922 trading days showed a gain (52.3%).
-Average 7-day return only during system days = +1.55%.
-Average 7-day return for all trading days = +0.20%.
-The 7-day system period has showed a gain in 62 of the past 80 years (or 77.5% of the time)
One other thing to note is that returns (and albeit risk) is enhanced by trading leveraged funds such as ticker UDPIX (Profunds UltraDow) or UDOW (ProShares UltraDow30 ETF).
Summary
So is the Dow destined to be higher at the close on January 6, 2014 than it was at the close on December 24th, 2013? Not necessarily. But that would seem to be the way to bet.
Jay Kaeppel


