Original article by Sylvain Vervoort Stocks & Commodities August 2013
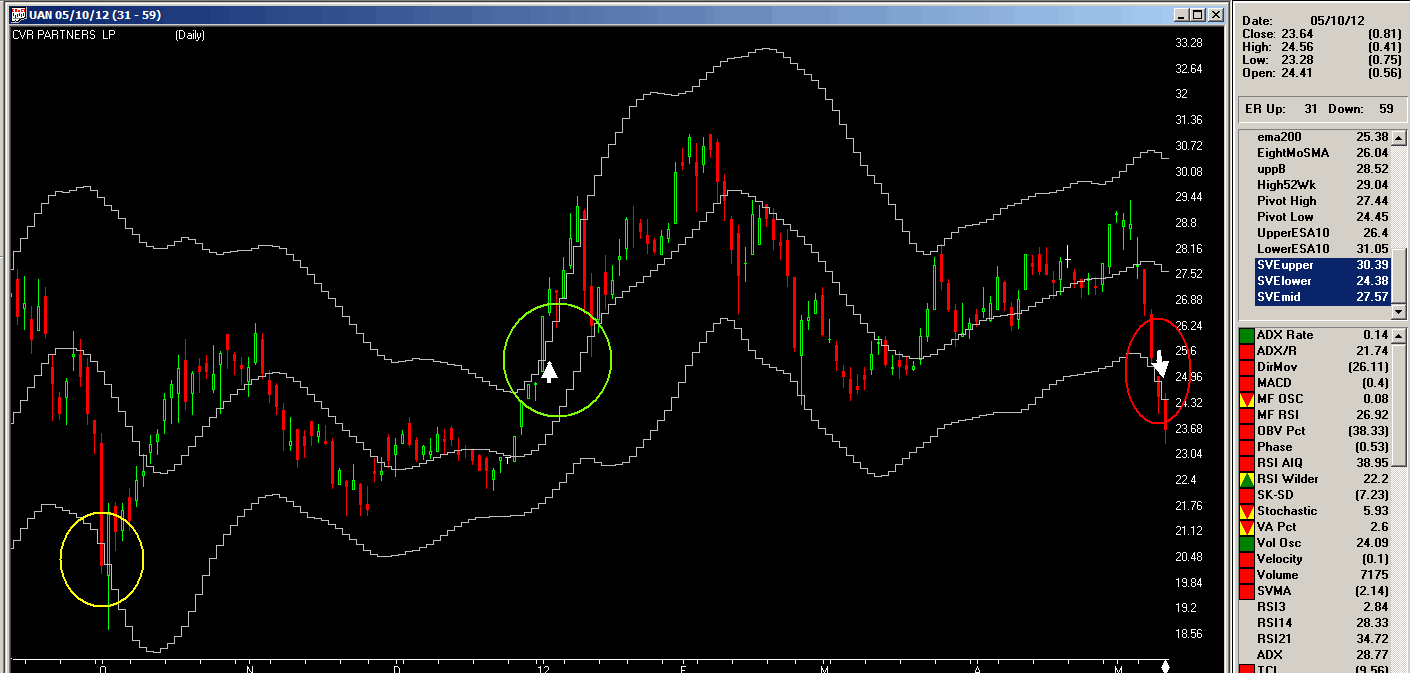
In Figure 1, I show a chart of CVR Partners LP (UAN) with the setup (yellow circle), the buy signal (green circle) and the exit (red circle). The author indicates that a valid buy signal does not occur unless the closing price has penetrated the lower band and then it closes above the upper band.
On 10/3/11, the close of 20.25 is below the lower band of 20.81 and then we have to wait until 1/3/12 for the close of 26.48 to be above the upper band of 25.36. We would enter the next day at the opening price of 26.57.
We would stay in the trade until the closing price is below the lower band. The exit does not occur for several months on 5/9/12 when the close of 24.45 is below the lower band of 27.76. We would then exit the next day at the open of 24.41 for a loss of $2.07 plus commission and slippage.
The highest close of the trade occurred on 2/2/12, just a few weeks after the entry, for a high open profit of $4.35. The trade would have been profitable if we had used the middle band as the exit. Note that I did not code the suggested trading system as the author indicates that more is to come in future parts of the article series.
(right click and choose Save As)


